TransRe's 2020 View Of Large Law Firm E&O
Our analysis of the lawyers’ liability market is based upon the insurers we serve, and the data we receive. As a result, the underlying data is not identical to last year’s analysis. Large law firms are predominantly insured by carriers that write in multiple states and focus on firms with 25 or more attorneys. Our analysis therefore excludes data from mutuals, captives and risk retention groups.
Our analysis is based on on-level premium of approximately $4.9B from 2007 – 2019 and on aggregated internal submission data reviewed through October 1, 2020.
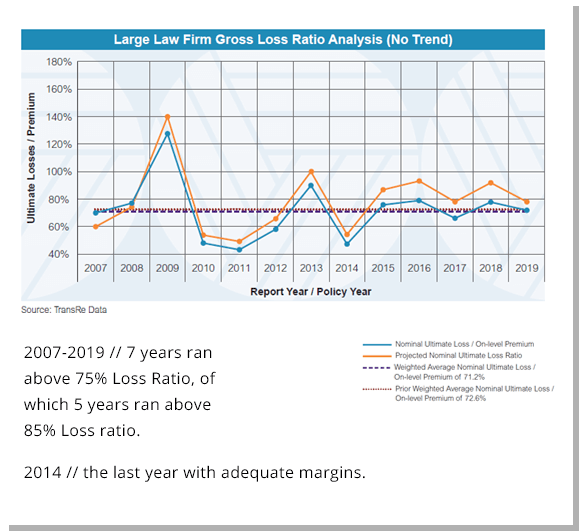
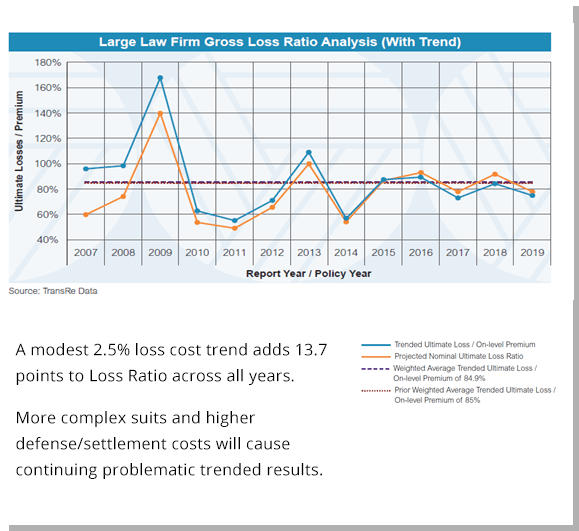
The charts first exclude, then include an annual loss cost trend assumption of 2.5%. 2019 is still relatively immature at this point, with estimates largely driven by IBNR.
| 84.9% | Ultimate Loss Ratio |
|---|---|
| 15.0% | Acquisition Costs |
| 12.5% | Internal Expenses |
| 112.4% | Combined Ratio |
It's just math, and It's
unsustainable
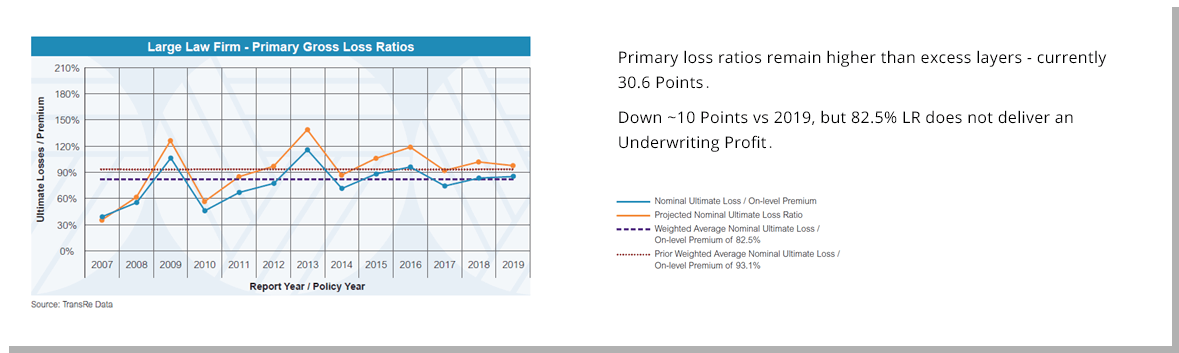
Primary & Excess Analysis
Our analysis of the difference between primary and excess layers is based on on-level premium of $1.3B for primary and $0.8B for excess from 2007 – 2019, and on aggregated internal submission data reviewed through October 1, 2020.
Claims Data
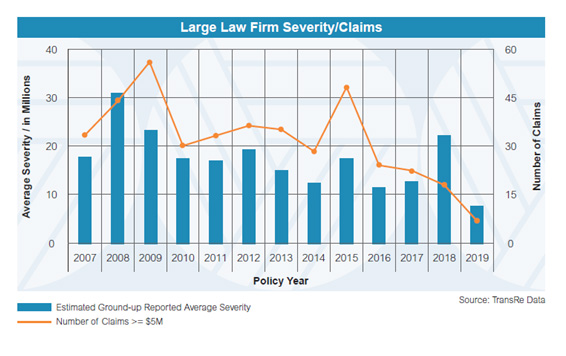
Our analysis of severity, large loss claims and estimated industry reported losses is based on estimated ground-up losses valued at $5 million or more. These total $7.7B across all years.
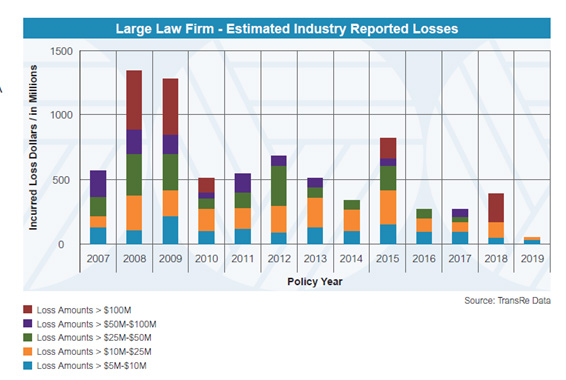
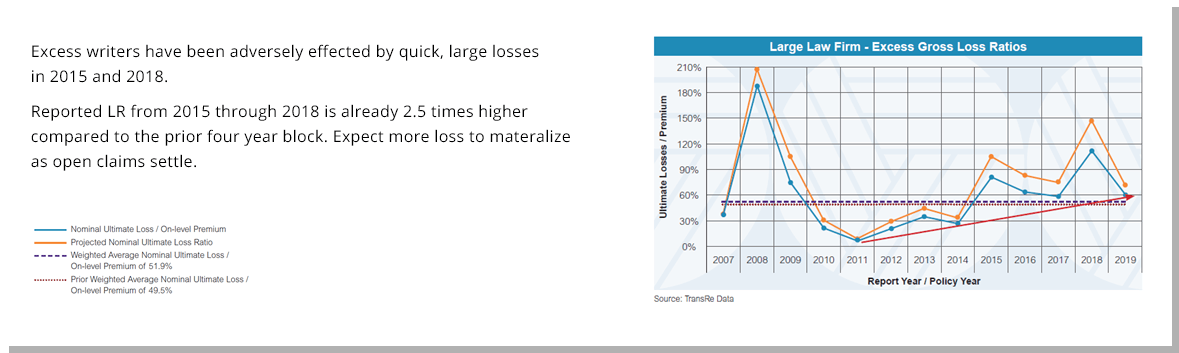
- 2015 and 2018 continue to be problematic.
- They are still not fully developed - in the past 12 months those years have seen ~$350M development from losses over $5M.
- 2016 and 2017 are each up over $100M in incurred losses from claims over $5M compared to last year.
- To date we have observed 112 claims greater than $5M from 2015 to 2018 which are still not fully developed.
- 2011 shows ~$100M in unexpected losses from claims in the $50M to $100M band.
Large Law Firm
Policy Year Rate Index
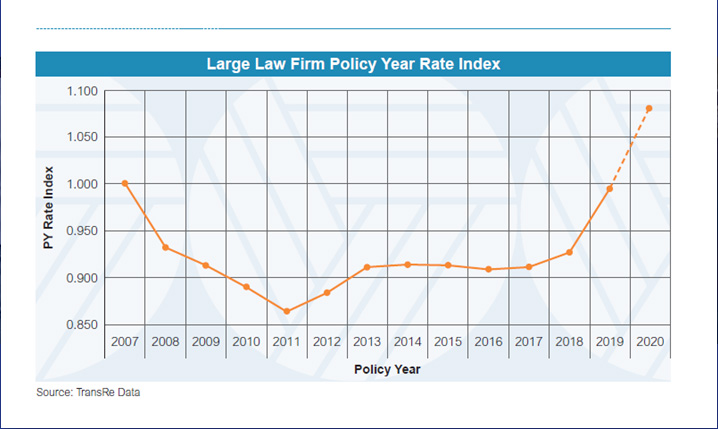
Our analysis is based on rate changes reported in submissions reviewed through October 1, 2020.
Using 2007 as our base:
- 2011 hit a low of premiums vs exposure, as Financial Crisis losses were paid.
- 2011-2017 premiums/exposure flatlined before 2018/2019 rate improvements finally returned the index to 2007 levels.
- As carriers have paid the losses shown on prior pages, rates rose 8.7% in the first half of 2020. While this is a step in the right direction, more must be done to enable a long term sustainable marketplace.