Losses are being driven by the severity of mega/large cap claims.
2023 is showing early signs of deterioration, although it is too soon to say whether that will continue, and whether 2024 and 2025 will follow.
Against a backdrop of rising losses, pricing sentiment remains strangely complacent, especially for mid-excess layers, the market segment that appears most vulnerable.
‘Fighting for flat’ was last year’s less-than-inspiring rallying cry. As losses continue to pile up, we need a new slogan before this cycle of D&O underwriting is remembered as the time when we forgot what profit looks like.
We start with the fundamentals, and nothing is more fundamental than losses.
Cornerstone Research tracks Securities Class Action activity, and we track their data.
Although 2025’s overall frequency was lower than 2023/2024 and (just) below the long term average, we have already seen 65 filings (260 annualized) in the first quarter of 2026:
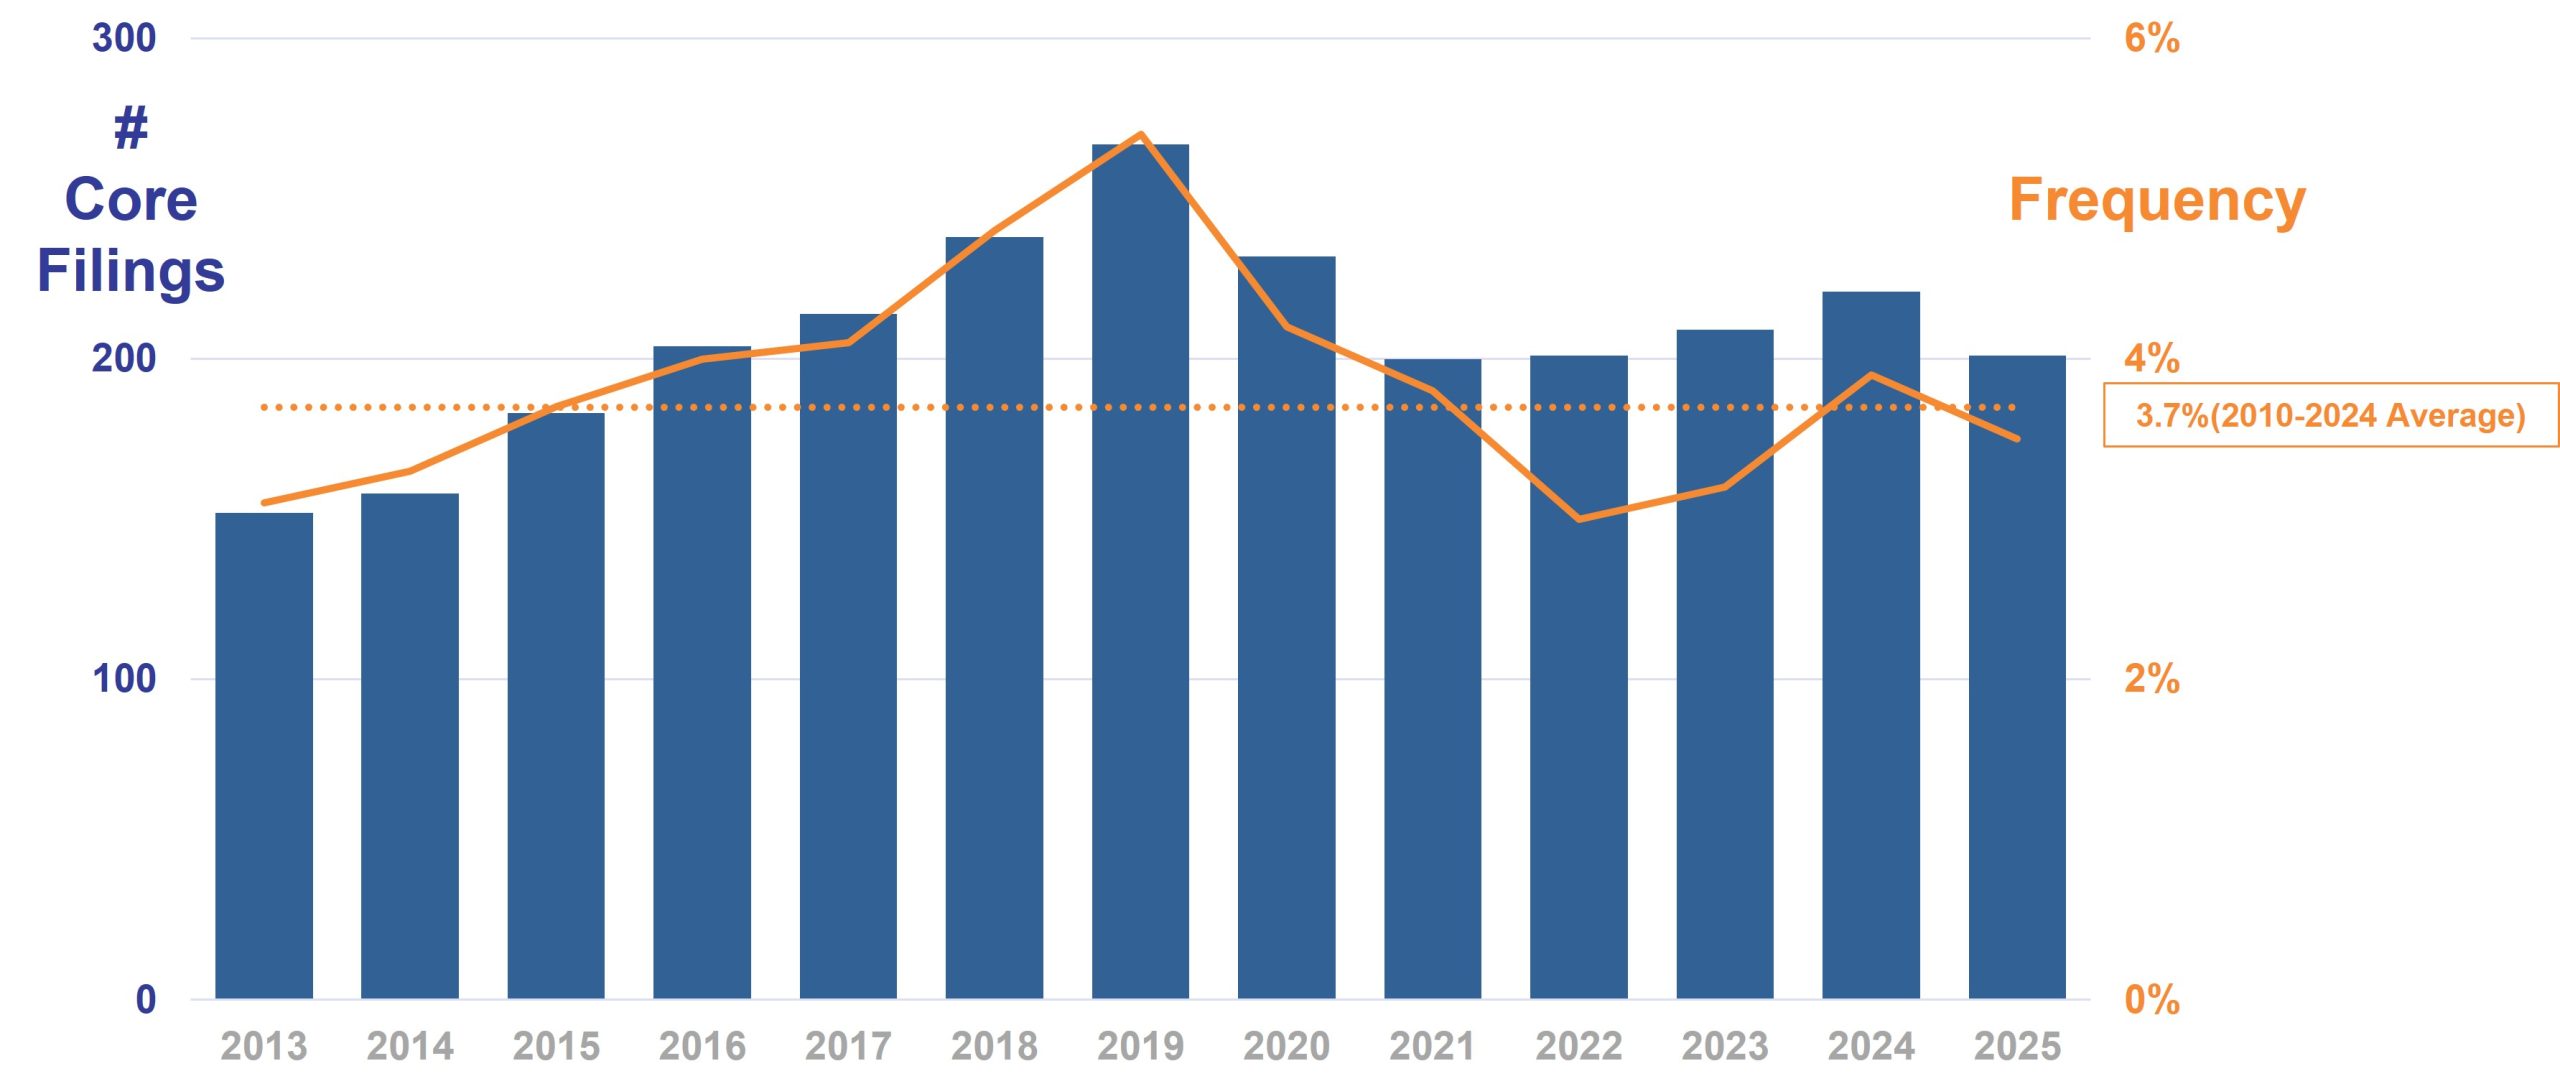
Source: Cornerstone Research
Large ($10-$100B) and Mega ($100B+) cap companies almost always exceed the overall filing frequency:
Source: SSLA, Factset, TransRe
Adopting Cornerstone’s DDL (Disclosure Dollar Loss = the dollar-value change in the defendant firm’s market capitalization between the trading day immediately preceding the end of the class period and the trading day immediately following the end of the class period). MDL (Maximum Dollar Loss = the dollar-value change in the defendant firm’s market capitalization from the trading day with the highest market cap during the class period to the trading day immediately following the end of the class period) methodology, adjusted to 2025 dollars, we note:
In 2025 mega caps delivered the highest ever DDL ($694B vs $429B in 2024) and the third highest ever MDL. Mega cap filings also represented a higher share of total DDL and MDL than the long term (1997-2024) average:
Source: SSLA, FactSet, TransRe
Although large caps saw some (temporary) relief in 2025, both mega and large caps show the same general upward trend:
Source: SSLA, FactSet, TransRe
A quick look at median settlements, split by market cap, tells a similar story, mega cap outcomes are also driving severity as much as frequency:
Source: SSLA, FactSet, TransRe
Although less discussed than ‘social’ inflation, the 44% cumulative rise in legal fees since 2020 impacts the cost of defending claims, and increasingly eats through working layers and exacerbates excess layer severity. The longer a case survives, the higher the costs (discovery/legal fees) and the greater the fear of a catastrophic/nuclear outcome. This may lead to defendants settling cases that they should otherwise defend.
Source: Bureau of Labor Statistics, St Louis Fed (FRED)
Individual outcomes may be difficult to predict, but the overall frequency and severity indicators are clear.
In our actuarial analysis, we assume 70% is the market breakeven loss ratio, after 15% acquisition costs and 15% internal expenses. We calculate margin dollars are GWP* (70% – expected ULR).
Clearly the low losses and price gains in 2021/2022 helped generate strong expected results. However the combination of recent losses, legal cost inflation and exposure growth is fast eroding that ‘bank’:
Source: TransRe
Widening our view to industry-wide loss ratios (Other Liability Claims Made in Schedule P) we compared first picks against latest. The 2016/19 years are bad and getting worse, 2020/22 are good and getting better, but 2023 is already ringing alarm bells and further deterioration is a real possibility – OLCM includes Cyber and Transactional Liability, which have seen early development. Although 2024 and 2025 are too new to officially call, recent pricing provides little comfort.
Source: Schedule P
Loss ratios are a function of prices as well as losses. Having reviewed the evidence of frequency, severity and legal inflation, rational observers might expect prices to have risen. Said observers would be disappointed.
Overall, prices have stopped dropping, yet the low/mid-excess layers remain under the most pressure, despite being vulnerable to any increase in severity. Insurers have targeted these lower excess layers via drop-down strategies in recent years, and we wonder if ILFs here are now the weakest in the tower?
Source: TransRe (index excludes IPO/SPAC data to highlight more general trends).
Mega and large cap prices have levelled off, but are now -13 and -17% off their peak respectively. These companies have the highest frequency and severity yet the chart below shows they have garnered the least amount of price since 2013, despite the dramatic rise in market caps and therefore growth in exposure.
Source: TransRe
Although more policies are renewing flat, those renewing down did so at an average of -10% in 2025, and too few have achieved price increases since the end of 2021.
Source: TransRe
Last year we noted the race to give back profits before they are fully earned, and we take little pleasure in the mounting evidence that severity is trending upward, but prices are only flattening, which (in our opinion) is not enough to weather the challenges ahead.
Overall SCA frequency appears to have reverted to the long-term average, but not for Mega and Large cap defendants. We are also seeing alarming indicators of potential severity and our ‘risk off’ position is unchanged.
An excess of capacity, an ongoing desire by many carriers to reposition lower in towers and a reluctance to vigorously defend claims combine to weaken insurers’ pricing power at a time when external dynamics (geopolitical volatility, legal inflation) point to the need for significant rate rises.
The path to profitability seems clear.
Over decades (and billions of premiums and corresponding claim payments) we have accumulated significant management and professional liability data and insights. We supplement this with licensed third party data and publicly available information, combined into our proprietary analytics engine. Our database includes details of 30,000+ policies.
We separate out Financial Institutions and sub-divide Commercial by company size and attachment point:
We focus on price rather than rate, to exclude (untrackable) changes in coverage.
In addition to general inflation (CPI) and Legal Services inflation (LSI)we monitor underlying loss cost trend (not just defense costs) which reflects increased severity as the plaintiffs’ bar pursues fewer but more likely cases and asks for more.
We only include the business we see. While we believe this to be a majority of what is available, it is not the entire market. In addition to publicly available data and our own insights, we use third-party data from a combination of FactSet, Stanford Securities Litigation Analytics, Stanford Law School Securities Class Action Clearinghouse, The D&O Diary, SNL and National Economic Research Associates (NERA), whose work we gratefully acknowledge. To maintain our claims database, we actively monitor major suits and their outcomes.
To discuss any aspect of this report, or your ongoing U.S. Public D&O reinsurance needs, please reach out to any member of the production team:
Portfolio Management
Elise McKenzie
Anthony Matteo
Ben Casey
Geet Shah
Underwriting
Daniel Hojnowski
Alexa Cosenza
George Delaney
William Seymour
Mathew Yuen
Dierdre Zeppie
Lonny Agulnick (Fac)
Actuarial
Joe Marracello
Kevin Peterson
Claims
Seth Goldberg
You can also reach us at communications@transre.com.
Reproduction in any form without permission of TransRe is prohibited.
The material and conclusions contained in this document are for information purposes only and TransRe offers no guarantee for the completeness of its contents.
Statements in this document may provide current expectations of future events based on certain assumptions. These statements involve known and unknown risks, uncertainties and other factors which are not exhaustive. Although TransRe makes reasonable efforts to obtain information from reliable sources, TransRe does not guarantee the accuracy or completeness of the information given or any forward-looking statements made.
TransRe undertakes no obligations to revise or update any statements, whether as a result of new information, future events or otherwise, and in no event shall TransRe or any of its affiliates or employees be liable for any damage or loss arising in connection with the use of the information relating to this document.
(Bold = Derivative)
| 2013 | Activision Blizzard, Inc. |
| Barrick Gold Corporation | |
| Blackberry Limited | |
| DFC Global Corp | |
| Dole Food Company, Inc. | |
| Intuitive Surgical, Inc. | |
| J.C. Penney Company, Inc. | |
| Lumber Liquidators Holdings, Inc. | |
| Medtronic plc | |
| Onyx Pharmaceuticals, Inc. | |
| Poseidon Concepts Corp. | |
| 2014 | Advanced Micro Devices, Inc. |
| Altisource Portfolio Solutions SA | |
| American Realty Capital Properties, Inc. n/k/a VEREIT, Inc. | |
| Barclays PLC | |
| Cliffs Natural Resources, Inc. | |
| Cobalt International Energy Inc | |
| General Motors Company | |
| Genworth Financial, Inc. | |
| GT Advanced Technologies, Inc. | |
| Intercept Pharmaceuticals, Inc. | |
| L-3 Communications Holdings, Inc. | |
| Magnachip Semiconductor Corp. | |
| NII Holdings, Inc. | |
| Nu Skin Enterprises | |
| Och-Ziff Capital Management Group LLC | |
| Ocwen Financial Corporation | |
| Petroleo Brasileiro SA – Petrobas | |
| Ply Gem Holdings, Inc. | |
| Rayonier, Inc. | |
| RCS Capital Corporation | |
| Salix Pharmaceuticals Ltd | |
| Santander Consumer USA Holdings, Inc. | |
| SeaWorld Entertainment, Inc. | |
| Valeant Pharmaceutical International Inc. n/k/a Bausch Health Companies | |
| 2015 | 3D Systems Corporation |
| Alibaba Group Holding Limited | |
| American Realty Capital Properties Inc. (n/k/a VEREIT, Inc.) | |
| Charter Communications, Inc. | |
| Chemical & Mining Company of Chile, Inc. (SQM) | |
| Clovis Oncology, Inc. | |
| Dole Food Company, Inc. | |
| Good Technology, Inc. | |
| Marvell Technology Group, Ltd. | |
| Miller Energy Resources, Inc | |
| Puma Biotechnology, Inc. | |
| Rite Aid Corporation | |
| SanDisk Corporation | |
| Sears Holdings Corporation | |
| Silver Wheaton Corporation | |
| Stellantis NV (f/k/a Fiat Chrysler Automobiles NV) | |
| SunEdison, Inc. | |
| TerraForm Global, Inc. | |
| Valeant Pharmaceutical International Inc. n/k/a Bausch Health Companies | |
| Volkswagen AG | |
| Volkswagen AG | |
| Walgreen Company | |
| 2016 | Adeptus Health, Inc. |
| Alexion Pharmaceuticals, Inc | |
| Allergan plc f/k/a Actavis plc | |
| American Capital Agency Corp. | |
| BHP Billiton Limited | |
| Brixmor Property Group, Inc. | |
| Cnova N.V. | |
| Cognizant Technology Solutions Corporation | |
| comScore, Inc. | |
| CoreCivic, Inc. f/k/a Corrections Corporation of America | |
| DeVry, Inc. | |
| Facebook, Inc. | |
| Fitbit Inc. | |
| HeartWare International, Inc. | |
| IMPAX Laboratories, Inc. | |
| Insys Therapeutics, Inc. | |
| LendingClub Corporation | |
| Lions Gate Entertainment Corp. | |
| Navient Corporation | |
| Orbital ATK, Inc | |
| Patriot National, Inc. | |
| Perrigo Company plc. | |
| Signet Jewelers Limited | |
| Stericycle, Inc. | |
| Sunrun, Inc. | |
| Taro Pharmaceutical Industries, Ltd. | |
| Tesla, Inc. | |
| Teva Pharmaceutical Industries Limited | |
| The Allstate Corporation | |
| The Fresh Market | |
| TreeHouse Foods, Inc. | |
| Twitter, Inc. | |
| Twitter, Inc. | |
| Wells Fargo & Company | |
| Wells Fargo & Company | |
| Zimmer Biomet Holdings, Inc | |
| 2017 | Arconic Corporation f/k/a Arconic, Inc. |
| Calamos Asset Management, Inc. | |
| Chicago Bridge & Iron Co. NV | |
| DaVita, Inc. | |
| DaVita, Inc. | |
| Endo International plc | |
| Envision Healthcare Corporation | |
| Equifax, Inc. | |
| Equifax, Inc. | |
| FleetCor Technologies, Inc. | |
| General Electric Company | |
| Harman International Industries, Inc. | |
| HD Supply Holdings, Inc. | |
| Lumen Technologies, Inc. (f/k/a CenturyLink, Inc.) | |
| Mallinckrodt plc | |
| McKesson Corporation | |
| Novo Nordisk A/S | |
| Omega Healthcare Investors, Inc. | |
| Ophthotech Corporation (n/k/a IVERIC Bio, Inc.) | |
| Pacific Gas & Electric Corporation | |
| Qualcomm, Inc. | |
| RH, Inc. | |
| SCANA Corporation | |
| SCANA Corporation | |
| Snap, Inc. | |
| Tableau Software, Inc. | |
| The Southern Company | |
| Towers Watson & Co. | |
| Twenty-First Century Fox, Inc. | |
| Under Armour, Inc. | |
| United States Steel Corporation | |
| Yahoo! Inc. | |
| Yahoo!, Inc. | |
| 2018 | Acadia Healthcare Company, Inc. |
| ADT, Inc. | |
| Advance Auto Parts, Inc. | |
| Aegean Marine Petroleum Network, Inc. | |
| Akorn, Inc. | |
| Alphabet, Inc. f/k/a Google, Inc. | |
| AmTrust Financial Services, Inc. | |
| Bank OZK | |
| BRF S.A. | |
| Celgene Corporation | |
| Columbia Pipeline Group, Inc. | |
| Dentsply Sirona, Inc. | |
| Diamond Resorts International, Inc. | |
| Fluor Corporation | |
| GreenSky, Inc. | |
| Grupo Televisa, S.A.B. | |
| Henry Schein, Inc. | |
| Immunomedics, Inc. | |
| Longfin Corp. | |
| McKesson Corporation | |
| Micro Focus International plc | |
| Newell Brands, Inc. | |
| Nielsen Holdings plc | |
| Nissan Motor Co., Ltd. | |
| NortonLifeLock Inc. f/k/a Symantec Corporation | |
| Pacific Gas & Electric Corporation | |
| Patterson Companies, Inc. | |
| Pilgrim’s Pride | |
| Renren, Inc. (n/k/a Moatable, Inc.) | |
| Synchrony Financial | |
| TrueCar, Inc. | |
| WageWorks, Inc. | |
| Wells Fargo & Company | |
| Wells Fargo & Company | |
| Windstream Holdings, Inc. | |
| Wynn Resorts Limited | |
| Wynn Resorts Limited | |
| 2019 | 2U, Inc. |
| Alphabet, Inc. | |
| Altria Group, Inc. | |
| Apple Computer, Inc. | |
| Blackhawk Network Holdings, Inc. | |
| CannTrust Holdings, Inc. | |
| CannTrust Holdings, Inc. | |
| Carbonite, Inc. | |
| Cardinal Health, Inc. | |
| Cardinal Health, Inc. | |
| Conduent, Inc. | |
| Coty, Inc. | |
| Covetrus, Inc. | |
| EQT Corporation | |
| Exelon Corporation | |
| Granite Construction, Inc. | |
| Green Dot Corporation | |
| Grubhub, Inc. | |
| Kraft Heinz Company | |
| Mallinckrodt plc | |
| Mattel, Inc. | |
| Maxar Technologies, Inc. | |
| Mindbody, Inc. | |
| Myriad Genetics, Inc. | |
| Nutanix, Inc. | |
| Pattern Energy Group, Inc | |
| Perrigo Company plc. | |
| Plantronics, Inc. | |
| ProPetro Holding Corp. | |
| Prudential Financial, Inc. | |
| Qihoo 360 Technology Co. Ltd. | |
| Resideo Technologies, Inc. | |
| Silver Run Acquisition Corporation II | |
| Spectrum Brands Holdings, Inc. | |
| Stamps.com, Inc. | |
| Stamps.com, Inc. | |
| The Boeing Company | |
| The Goldman Sachs Group, Inc. | |
| Uber Technologies, Inc. | |
| Uniti Group, Inc. f/k/a Communications Sales & Leasing, Inc. | |
| Viacom, Inc. (Merger with CBS Corporation) | |
| Zuora, Inc. | |
| 2020 | Aimmune Therapeutics, Inc. |
| Akazoo S.A. f/k/a Modern Media Acquisition Corp. | |
| Alibaba Group Holding Limited | |
| Altria Group, Inc. | |
| AmerisourceBergen Corp. | |
| Bayer Aktiengesellschaft [Bayer AG] | |
| Becton, Dickinson and Company | |
| BioMarin Pharmaceutical, Inc. | |
| Boston Scientific Corporation | |
| CBS Corporation | |
| Coterra Energy Inc. (f/k/a Cabot Oil & Gas Corporation) | |
| Deutsche Bank AG | |
| FirstEnergy Corporation | |
| Forescout Technologies, Inc. | |
| GoHealth, Inc. | |
| Grand Canyon Education, Inc. | |
| HP, Inc. | |
| Inovio Pharmaceuticals, Inc. | |
| JELD-WEN Holding, Inc. | |
| L Brands, Inc. | |
| Luckin Coffee, Inc. | |
| Match Group, Inc. | |
| Mohawk Industries, Inc. | |
| Mylan, NV | |
| Pattern Energy Group, Inc. | |
| Pinterest, Inc. | |
| Pivotal Software, Inc. | |
| ProAssurance Corporation | |
| Ryder System, Inc. | |
| Six Flags Entertainment Corporation | |
| Splunk, Inc. | |
| Tesla, Inc. | |
| Tilray, Inc. | |
| Turquoise Hill Resources Ltd. | |
| VMware, Inc. | |
| Wells Fargo & Company | |
| World Wrestling Entertainment, Inc. | |
| Zoom Video Communications, Inc. | |
| Zuora, Inc. | |
| 2021 | AdaptHealth Corp. f/k/a DFB Healthcare Acquisitions Corp. |
| Alphabet, Inc. f/k/a Google, Inc. (Antitrust) | |
| Apache Corporation | |
| Chegg, Inc. | |
| ChemoCentryx, Inc. | |
| Credit Suisse Group | |
| DiDi Global Inc. f/k/a Xiaoju Kuaizhi Inc. | |
| Emergent Biosolutions, Inc. | |
| Emisphere Technologies, Inc. | |
| FibroGen, Inc. | |
| InnovAge Holding, Inc. | |
| James River Group Holdings, Ltd. | |
| Madison Square Garden Entertainment Corp. | |
| MSG Networks, Inc. | |
| MultiPlan Corporation f/k/a Churchill Capital Corp. III | |
| Novavax, Inc. | |
| Nutanix, Inc. | |
| QAD, Inc. | |
| QuantumScape Corporation (f/k/a Kensington Capital Acquisition Corp.) | |
| Reata Pharmaceuticals, Inc. | |
| Romeo Power Inc. f/k/a RMG Acquisition Corp. | |
| Sirius XM Holdings Inc. | |
| Snap, Inc. | |
| SolarWinds Corporation | |
| StoneCo Ltd. | |
| The Honest Company, Inc. | |
| Velodyne LiDAR, Inc. f/k/a Graf Industrial Corp | |
| ViacomCBS Inc. | |
| Walmart, Inc. | |
| Workhorse Group, Inc. | |
| Zymergen, Inc. | |
| 2022 | Cerence, Inc. |
| Compass Minerals International, Inc. | |
| CreateAI Holdings Inc. (f/k/a TuSimple Holdings, Inc.) | |
| GAIN Capital Holdings, Inc. | |
| Getty Images Holdings, Inc. | |
| Grab Holdings Limited f/k/a Altimeter Growth Corporation | |
| Guess?, Inc. | |
| LifeStance Health Group, Inc. | |
| Newmark Group, Inc. | |
| Oak Street Health, Inc. | |
| Okta, Inc. | |
| Olaplex Holdings, Inc. | |
| Opendoor Technologies, Inc. | |
| Pegasystems, Inc. | |
| Premier, Inc. | |
| Rivian Automotive, Inc. | |
| Santander Consumer USA Holdings, Inc. | |
| Sea Limited | |
| Silvergate Capital Corporation | |
| Stitch Fix, Inc. | |
| Talis Biomedical Corporation | |
| TuSimple Holdings, Inc. | |
| Walgreens Boots Alliance, Inc. | |
| Warner Brothers Discovery, Inc. | |
| Waste Management, Inc. | |
| Wells Fargo & Company | |
| 2023 | AdaptHealth Corp. f/k/a DFB Healthcare Acquisitions Corp. |
| AMC Entertainment Holdings, Inc. | |
| Catalent, Inc. | |
| Cornerstone Building Brands, Inc. | |
| Fidelity National Information Services, Inc. | |
| GWG Holdings, Inc. | |
| Hawaiian Electric Industries, Inc. | |
| Masimo Corporation | |
| Mercury Systems, Inc. | |
| Proterra, Inc. | |
| Sea Limited | |
| Spirit AeroSystems Holdings, Inc. | |
| 2024 | Doximity, Inc. |
| Equinix, Inc. |
| Insured | Nature of Allegation | Class Period | |
|---|---|---|---|
| Q1 | Micron Technology, Inc. | Weak product demand | 9/28/23-12/18/24 |
| Block, Inc. | Financial platforms failed to conduct KYC checks | 2/26/20-4/30/24 | |
| Crocs, Inc. | False/misleading statement of revenue growth around acquisition | 11/3/22-10/28/24 | |
| ESSA Pharma Inc. | Drug in development was less effective than claimed | 12/12/23-10/31/24 | |
| Novo Nordisk A/S | Obesity study overstated likely weight loss benefit | 11/2/22-12/19/24 | |
| Telus International Inc. | New AI offerings cannibalized existing sales | 2/16/23-8/1/24 | |
| Target Corporation | Marketing touched on culture wars/alienated part of customer base | 8/26/22-11/19/24 | |
| GSK plc | Zantac withdrawal | 2/5/20-8/14/22 | |
| Elastic N.V. | Significant changes to sales operations disrupted sales | 5/31/24-8/29/24 | |
| Constellation Brands, Inc. | Wine & spirit division failed to increase profits | 4/11/24-1/8/25 | |
| The Trade Desk, Inc. | Delayed rollout and faulty execution of AI marketing platform | 5/9/24-2/12/25 | |
| Atkore Inc. | Price fixing of PVC Pipes | 2/1/24-2/3/25 | |
| Skyworks Solutions, Inc. | Semiconductor company misrepresented relationship with Apple | 7/30/24-2/5/25 | |
| e.l.f. Beauty, Inc. | Rising inventory levels due to weak sales | 11/1/23-11/19/24 | |
| Fluence Energy, Inc. | Battery storage company misrepresented relationship with largest customer | 11/29/23-2/10/25 | |
| Q2 | Bakkt Holdings, Inc. | Crypto software company dependent on one contract | 3/25/24-3/17/25 |
| BigBear.ai Holdings, Inc. | Deficient accounting of non-standard transactions | 3/31/22-3/25/25 | |
| Integrated Wealth Strategies, LLC. | Misrepresented risk profile of potential investment | 9/22/20-4/17/25 | |
| NET Power Inc. | Clean energy tech company underestimated cost/time to launch | 6/9/23-3/7/25 | |
| Avis Budget Group, Inc. | Faster fleet rotation shortened useful life of assets/increased depreciation | 2/15/24-2/10/25 | |
| West Pharmaceutical Services, Inc. | Medical supply/packaging company overstated benefits/effectiveness of solutions | 02/16/23-02/12/25 | |
| Bitfarms Ltd. | Data center/miner had deficient internal controls/ misstated financials | 03/21/23-12/09/24 | |
| Elevance Health, Inc. | Health insurer failed to monitor cost trends, and underpriced coverage | 04/18/24-10/16/24 | |
| Krispy Kreme, Inc. | Overstated demand for donuts at McDonalds | 2/25/25-5/7/25 | |
| DoubleVerify Holdings, Inc. | Digital marketing analytics company affected by shift to closed platforms | 11/10/23-02/27/25 | |
| Tempus Ai, Inc. | Medical solutions provider overstated capabilities & strength of relationships | 08/06/24-05/27/25 | |
| Reddit, Inc. | Change to Google’s algorithm affected traffic to site | 10/29/24-05/20/25 | |
| Apple, Inc. | Understated time to integrate SiriAI | 06/10/24-06/09/25 | |
| Hims & Hers Health, Inc. | Telehealth sold fake Wegovy | 04/29/25-06/22/25 | |
| Petco Health and Wellness Company, Inc. | Overstated ability to survive selling premium petfood | 1/14/21-6/5/25 | |
| Q3 | Centene Corp | Healthcare company misrepresented enrollment figures | 12/12/24-6/30/25 |
| Neogen Corporation | Overstated speed/benefits of acquisition/integration | 1/5/23-6/3/25 | |
| Fiserv, Inc. | payment gateway artificially boosted revenue | 7/24/24-7/22/25 | |
| Lockheed Martin Corporation | Failure of internal controls overstated contract profits | 1/23/24-7/21/25 | |
| Novo Nordisk A/S | Overstated growth potential of GLP-1 market | 5/7/25-7/28/25 | |
| Lineage, Inc. | Cold-storage manager IPO didnt disclose weakening demand | 7/25/2024 | |
| Tesla, Inc. | Overstated effectiveness of autonomous driving tech | 4/19/23 to 6/22/25 | |
| KinderCare Learning Companies, Inc. | Education IPO failed to mention cases of child abuse/neglect/harm | 10/9/2024 | |
| Snap Inc. | Overstated ad revenue growth | 4/29/25-8/5/25 | |
| C3.ai, Inc. | Overstated revenue growth, underplayed CEO health concerns | 2/26/25-8/8/25 | |
| Nutex Health Inc. | Alleged fraud on insurance companies and stock compensation accounting issues | 8/8/24- 8/14/25 | |
| Charter Communications, Inc. | Broadband/cable operator understated impact of FCC changes | 7/26/24-7/24/25 | |
| Dow Inc. | Material science company overstated ability to support its dividend | 1/30/25-7/23/25 | |
| V.F. Corporation | Apparel company overstated true state of (Vans) turnaround plan | 10/30/23-5/20/25 | |
| Fluor Corporation | Engineering company failed to disclose rising project costs/slowing economic conditions | 2/18/25-7/31/25 | |
| Spirit Aviation Holdings, Inc. | Overstated financial health/downplayed risk of another Chapter 11 filing | 5/28/25-8/29/25 | |
| Q4 | WPP plc | Overstated revenue/growth and understated seasonality | 2/27/25-7/8/25 |
| Marex Group | Inconsistencies in financial statements, involving subsidiaries and related parties | 5/16/24-8/5/25 | |
| James Hardie Industries plc | Financial statements ignored/denied inventory de-stocking | 5/20/25-8/18/25 | |
| Synopsys, Inc. | Focus on AI impacted margins | 12/4/24-9/9/25 | |
| CarMax Inc. | Overstated growth prospects | 6/20/25-9/24/25 | |
| Fiserv, Inc. | Misled investors about initiatives and projects | 7/23/25-10/29/25 | |
| Six Flags Entertainment Corporation | Merger failed to mention underinvestment | 7/1/2024 | |
| Freeport-McMoran Inc. | Failure to ensure safety at Indonesian mine | 2/15/22-9/24/25 | |
| Perrigo Company Plc | Infant formula business (bought from Nestle) suffered underinvestment | 2/27/23 to 11/4/25 | |
| StubHub Holdings, Inc. | IPO documents failed to mention cashflow impact of payment timing changes | 9/17/2025 | |
| Sprouts Farmers Market Inc. | Understated impact of macroeconomic pressures | 6/4/25-10/29/25 | |
| Coupang, Inc. | Inadequate cybersecurity protocols | 8/6/25-12/16/25 | |
| SLM Corporation (“Sallie Mae”) | Failed to disclose rise in early stage delinquencies | 7/25/25-8/14/25 | |
| F5, Inc. | Failure to disclose security incident | 10/28/24-10/27/25 | |
| Klarna Group plc | Digital bank IPO understated risk of buy now pay later loan delinquency | 9/10/2025 |
The Best’s Company Report(s) reproduced on this site appear under license from A.M. Best and do not constitute, either expressly or implied, an endorsement of (Licensee)’s products or services. A.M. Best is not responsible for transcription errors made in presenting Best’s Company Reports. Best’s Company Reports are copyright © A.M. Best Company and may not be reproduced or distributed without the express written permission of A.M. Best Company. Visitors to this web site are authorized to print a single copy of the Best’s Company Report(s) displayed here for their own personal use. Any other printing, copying or distribution is strictly prohibited.
Best’s Ratings are under continuous review and subject to change and/or affirmation. To confirm the current rating, please visit the AM Best web site, www.ambest.com.