1. PRICE CHANGES
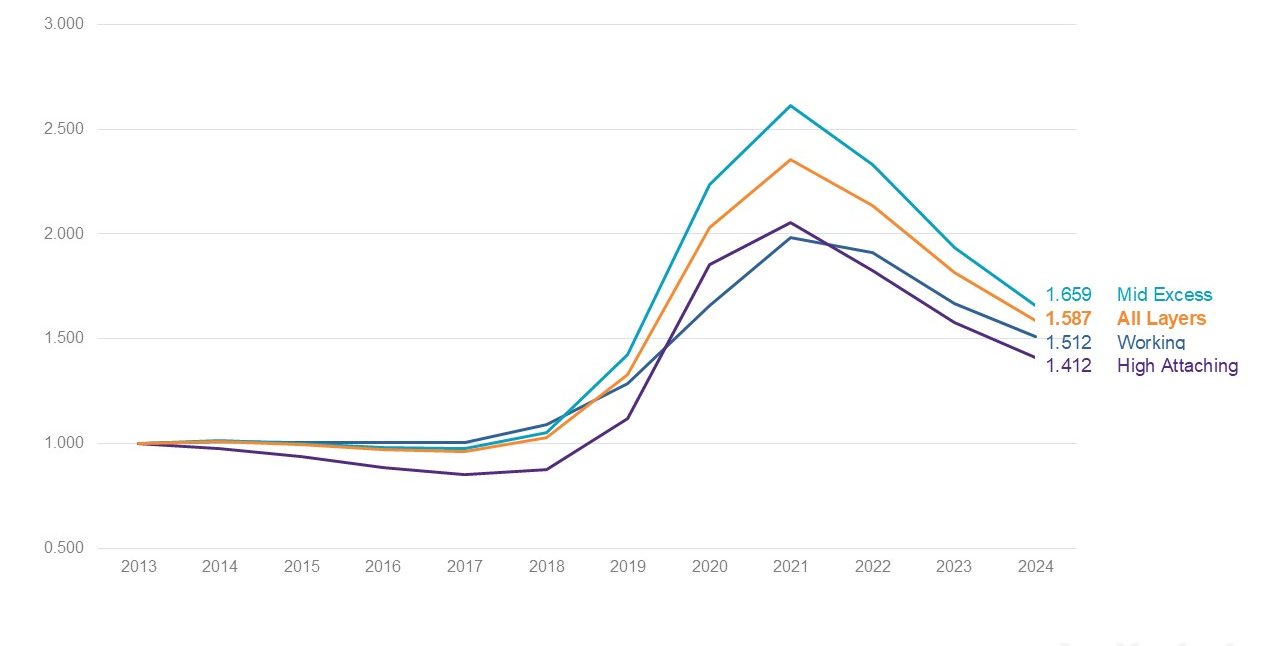
We start with the annual change in prices by attachment bands:
Note: we have excluded (where identifiable) IPO/SPACs/DeSPAC data from our price change exhibits to avoid the rapid increase and decrease of these high-premium programs from unduly affecting more general trends.
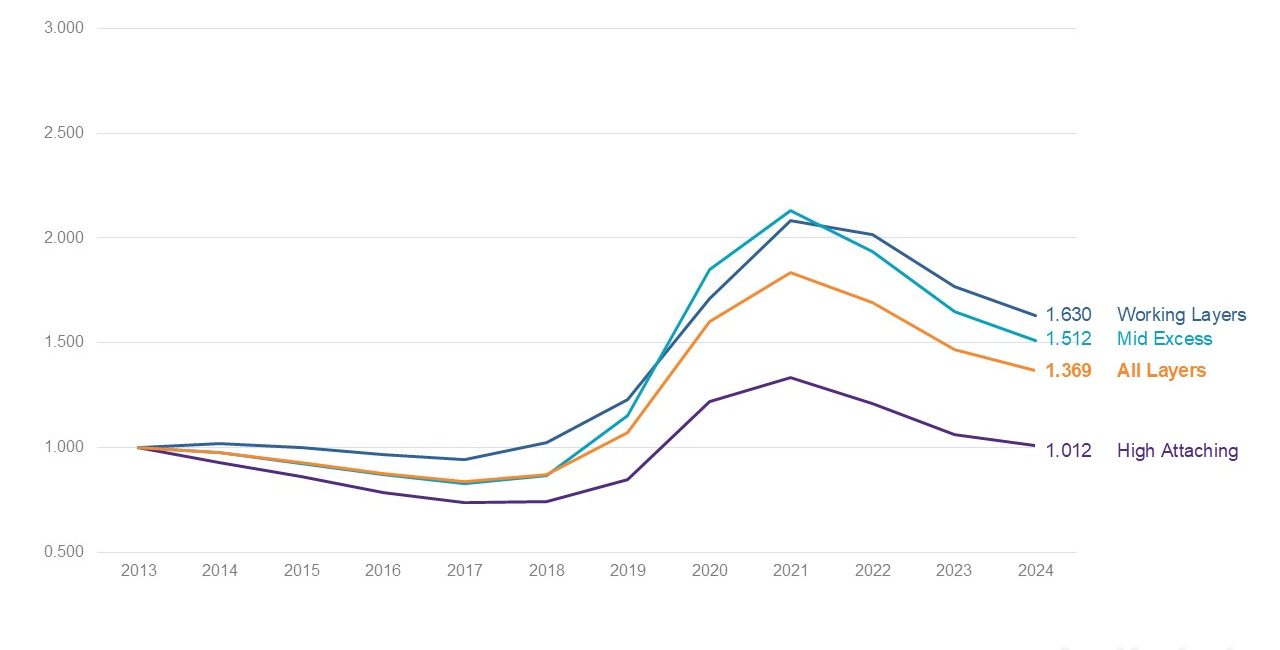
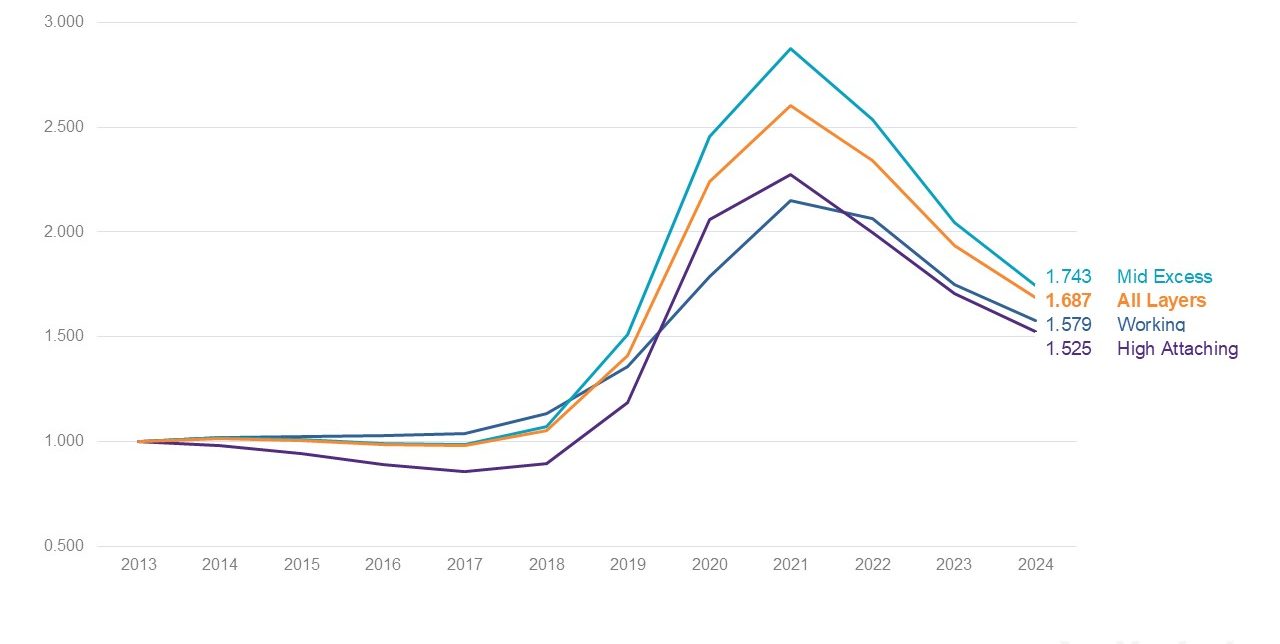
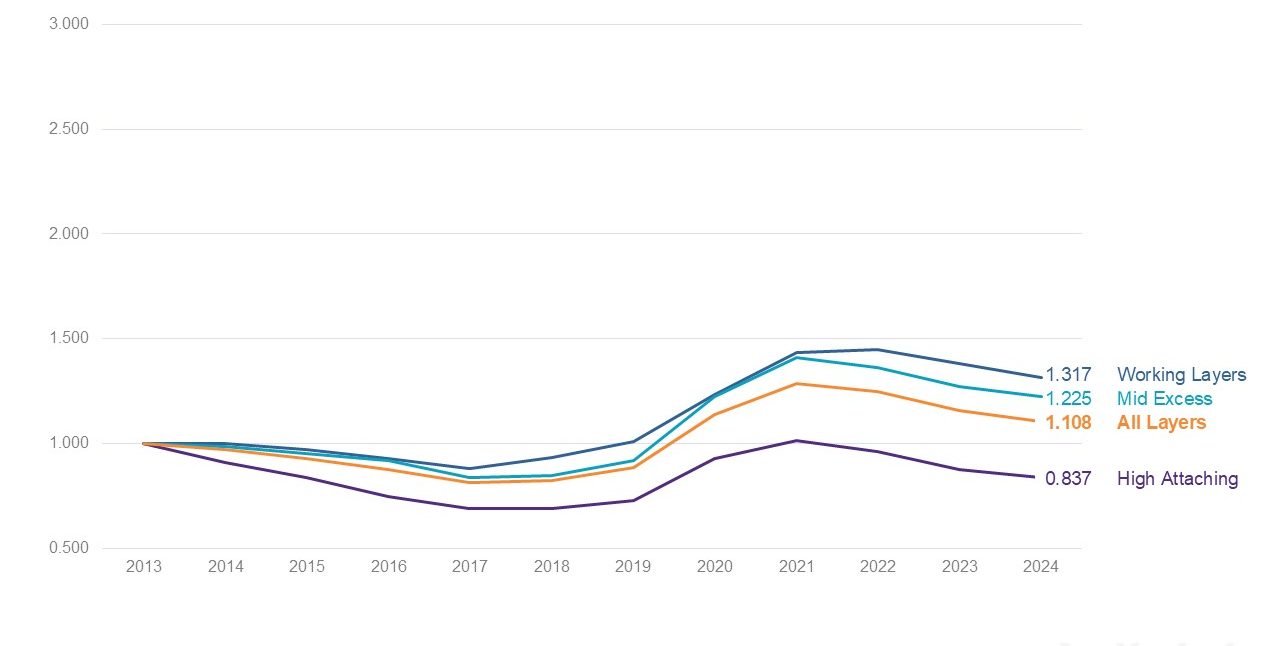
TransRe U.S. Public D&O Insurance Price Index
All Policies By Layer, 2013-2024
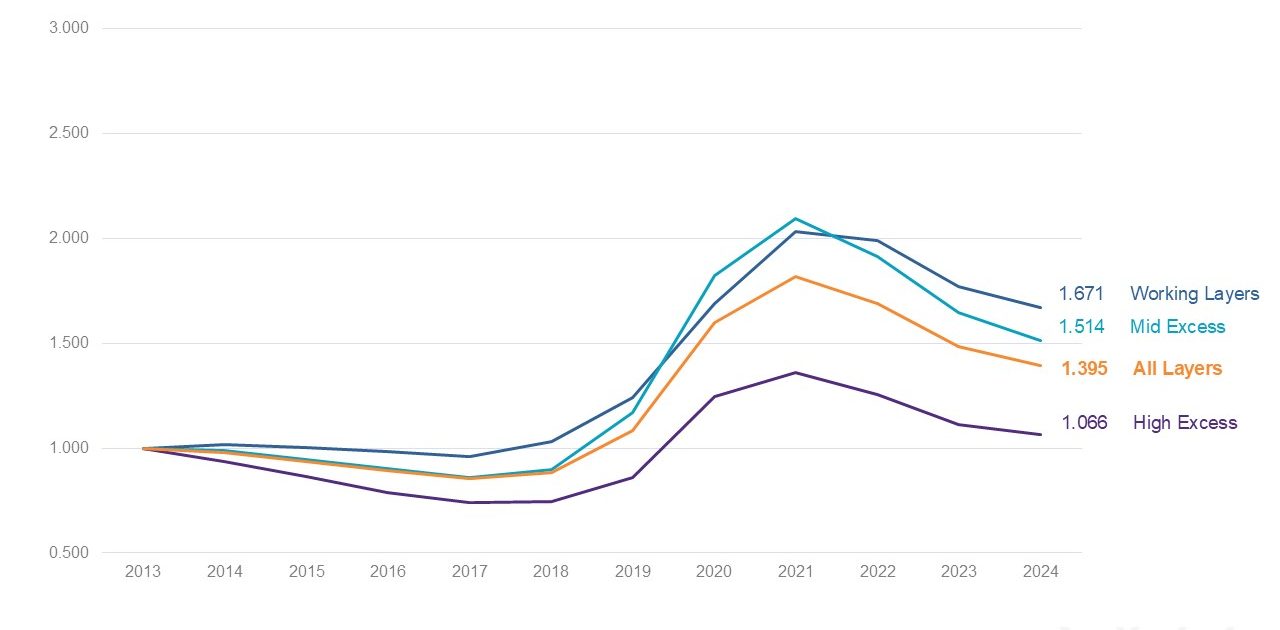
- The speed of reductions slowed in 2024 but prices continue to fall
- These are nominal changes, before adjusting for increased loss cost trends
- High excess layers are +6.6% since 2013. During that period the S&P500 has more than tripled as (by definition) has the average capitalization of each constituent company.
Then we split the data by size of insured:
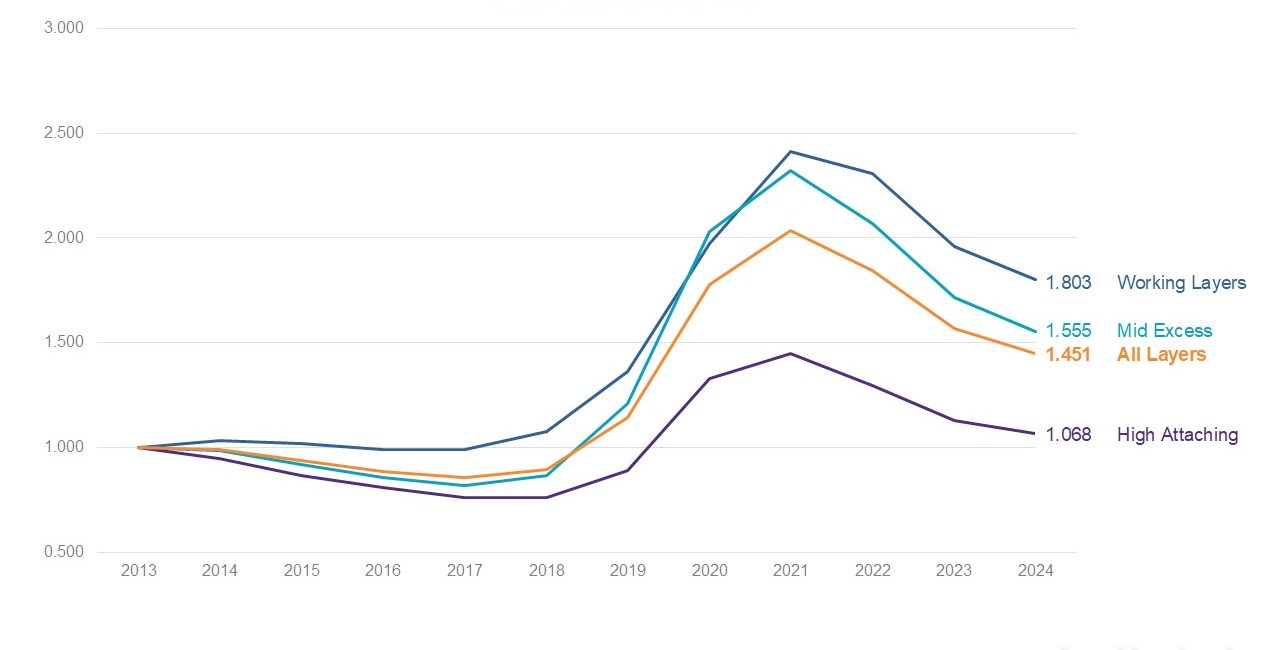
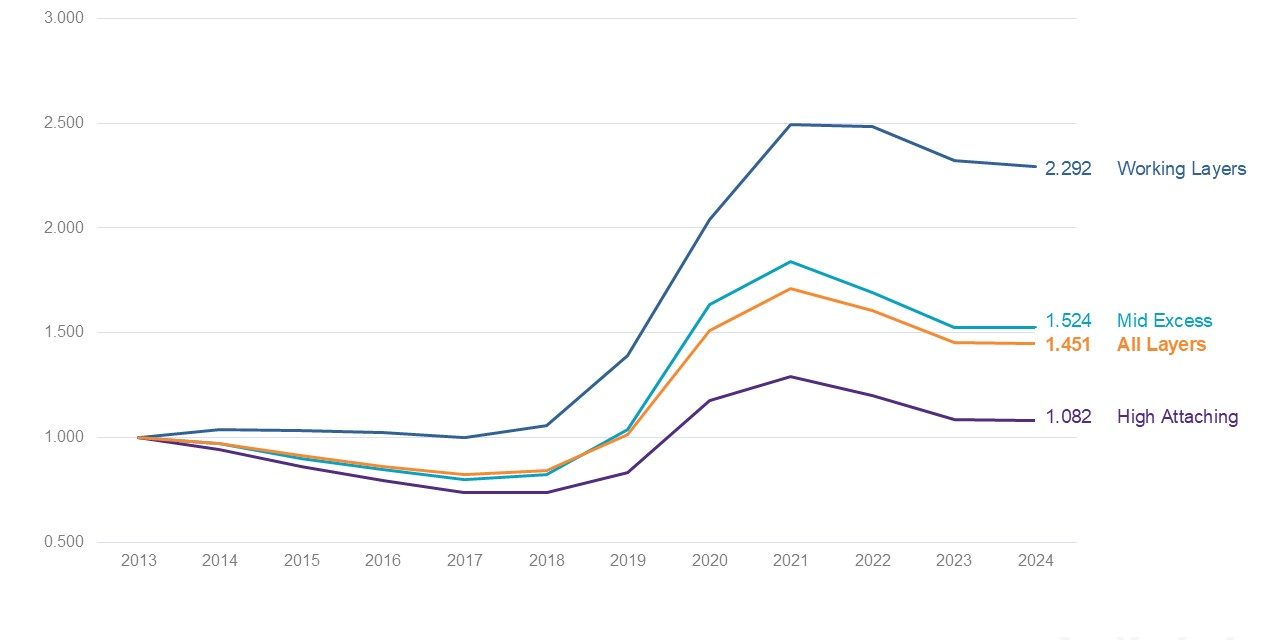
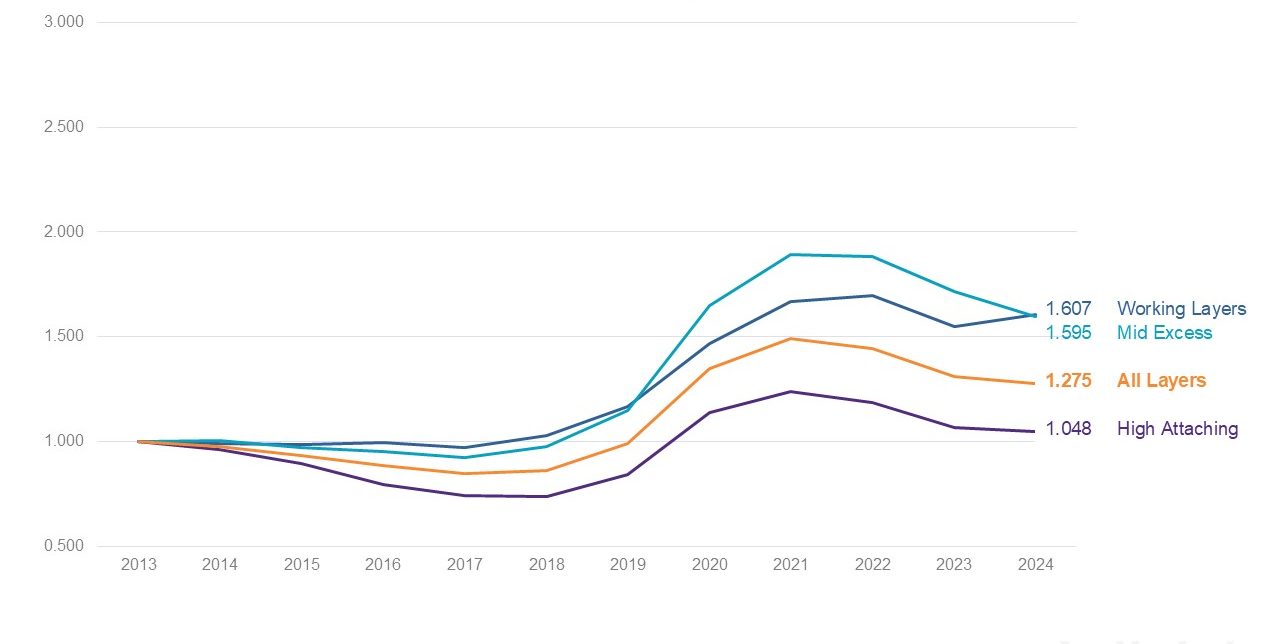
TransRe U.S. Public D&O Insurance Price Index
All Policies By Insured Market Cap, 2013-2024
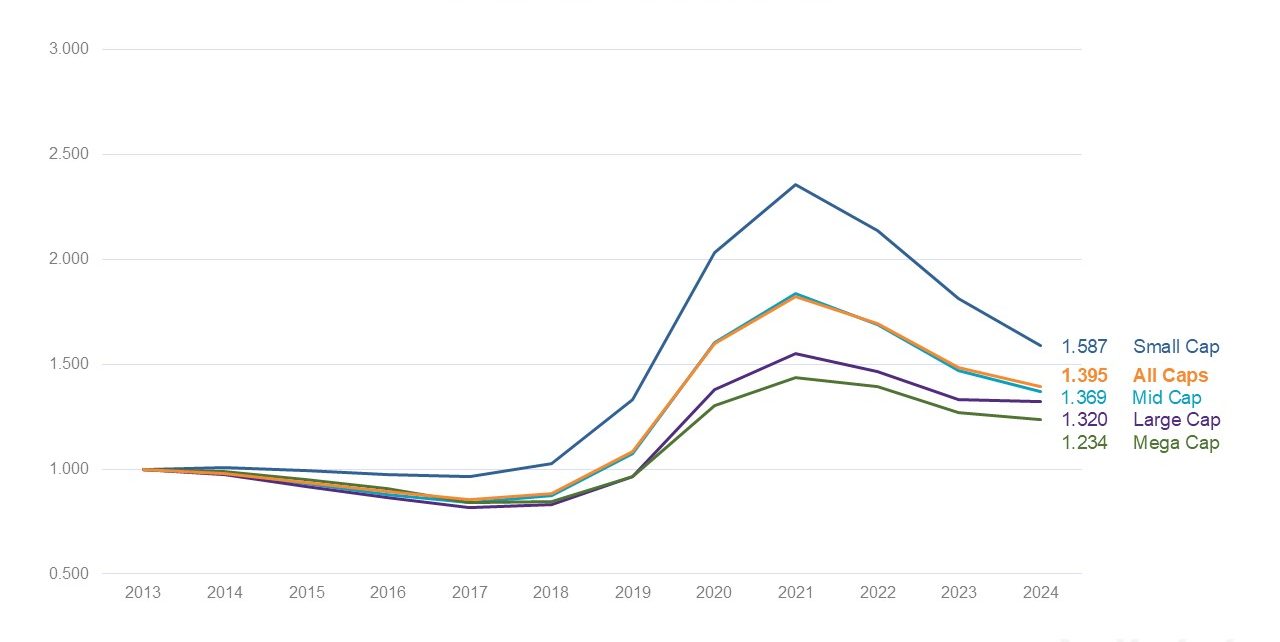
- Easy come, easy go? – small cap prices rose furthest, have fallen back fastest, and continue to do so
- Large cap prices are less volatile – they remain at higher risk of securities class actions
Changing to a quarterly view, we mapped all policies by whether they renewed up, down or flat:
Price Outcomes Of Renewing Policies
All Companies, 2018 – 2024
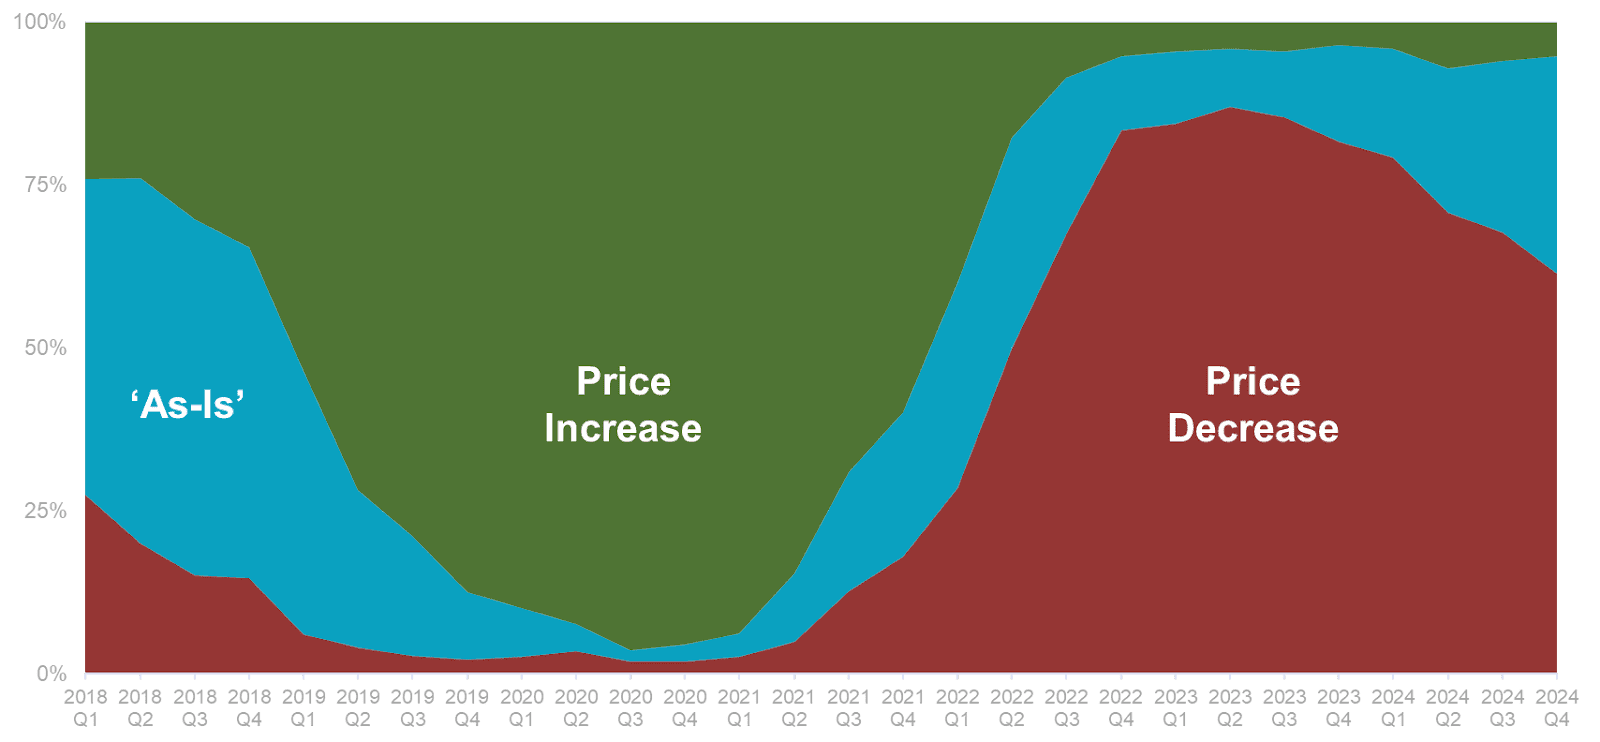
- In Q1 2018, among policies with price decreases, the average change was -8%
- By Q1 2023, when many more policies renewed down, that average change was -19%
- Although more policies have renewed flat recently, very few have renewed up, and more than three of every five policies continue to renew with price reductions
We compared how much prices have increased or decreased within each category:
Quantum Of Price Change
All Policies, 2018 – 2024
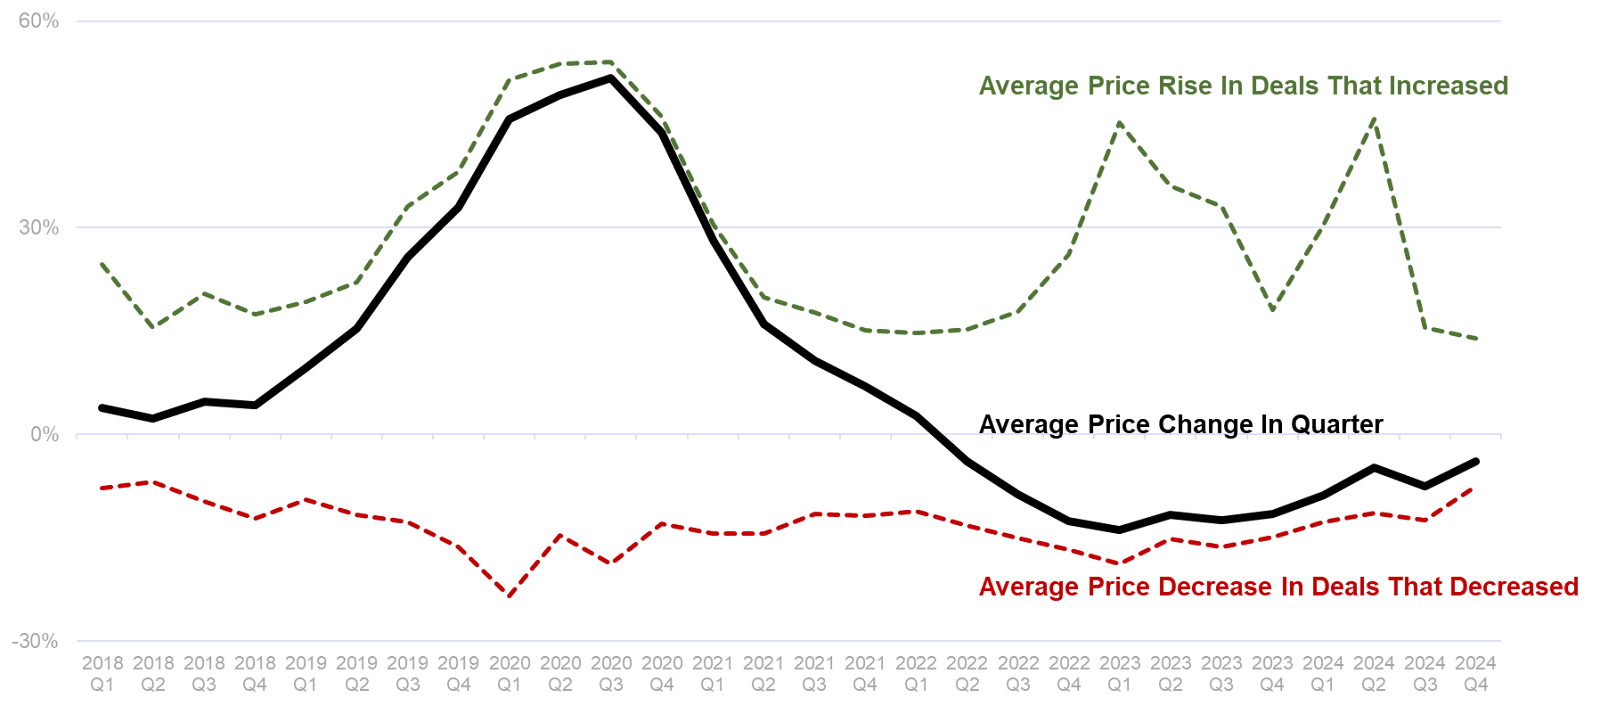
- In mid-2020, when most policies were renewing up, they were also renewing significantly (50%+) up (‘the necessary correction phase’)
- The market turned and as more policies renewed down, so the overall average change dropped dramatically. Q4 2024’s overall average price reduction was still at -3.9% (the ‘irrational group-think’ phase).
- The only insureds to see price rises are those who have reported a claim or have had some concerning developments. If everyone else’s price is dropping, insurers are clearly struggling to differentiate
The trajectory of price changes is insufficient to sustain profitability.
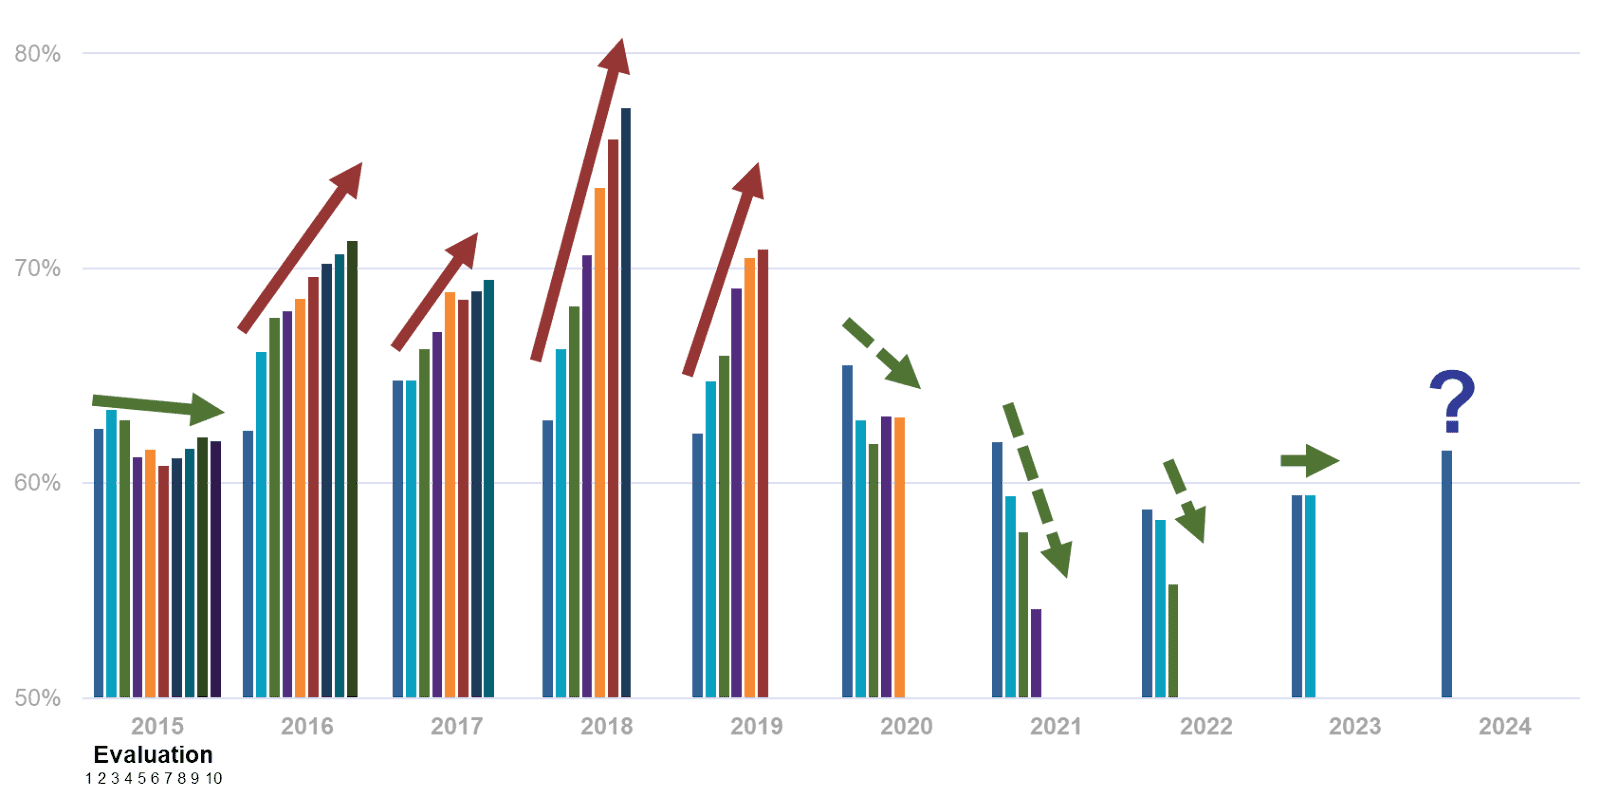
2. RENEWAL RETENTION RATES
Incumbents talk about intense competition from new players. We took a look:
Quarterly Retention Ratio
All Insureds, All Layers, 2018-2024
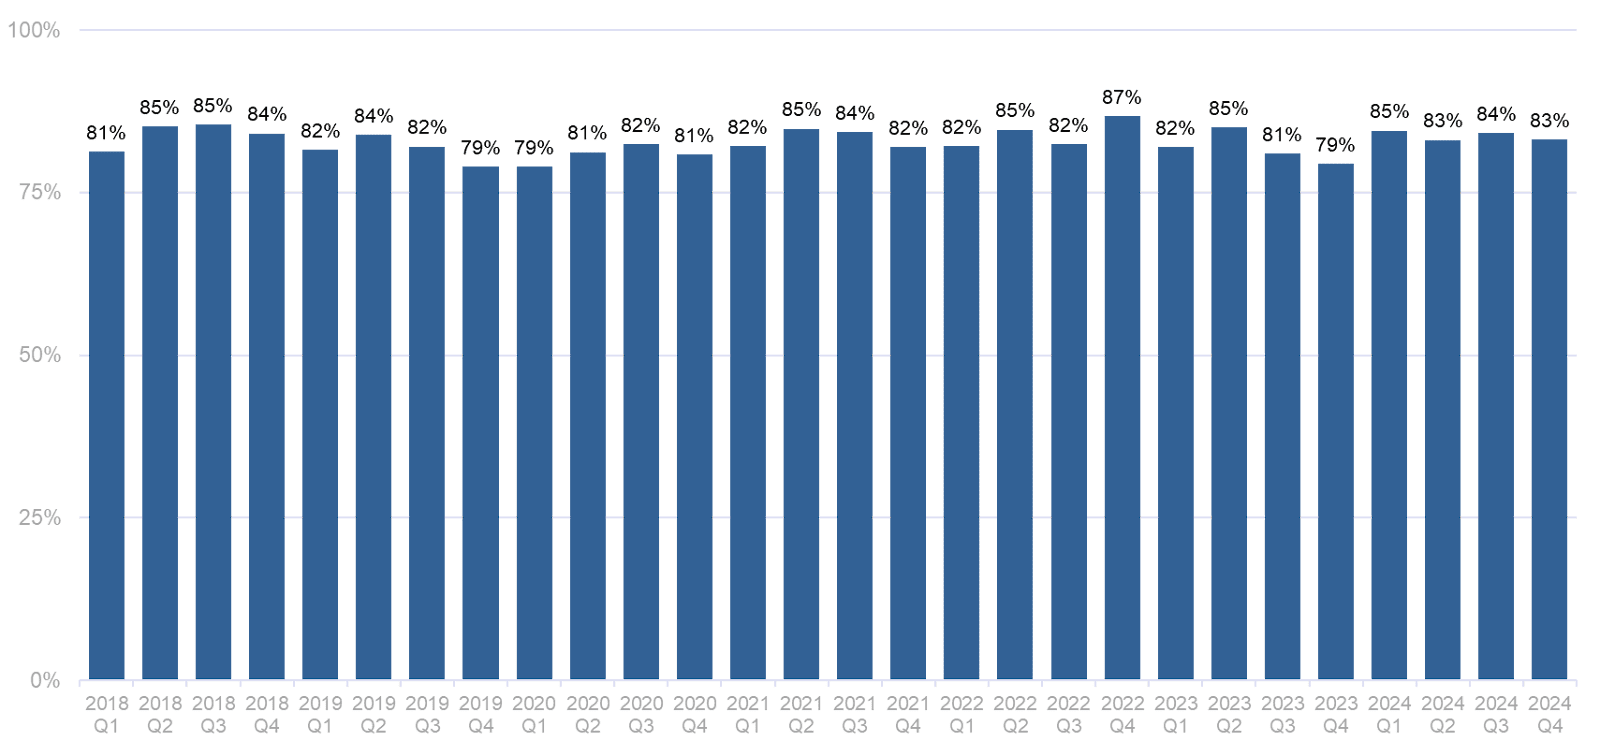
- Although there is much talk of demonstrating discipline, most business stays put. Even if new capacity is pressuring prices, nobody is stepping back.
We looked for differences in price changes by outcome – did the business stay or move?
Annual Price Change By Renewal Outcome
2018-2024
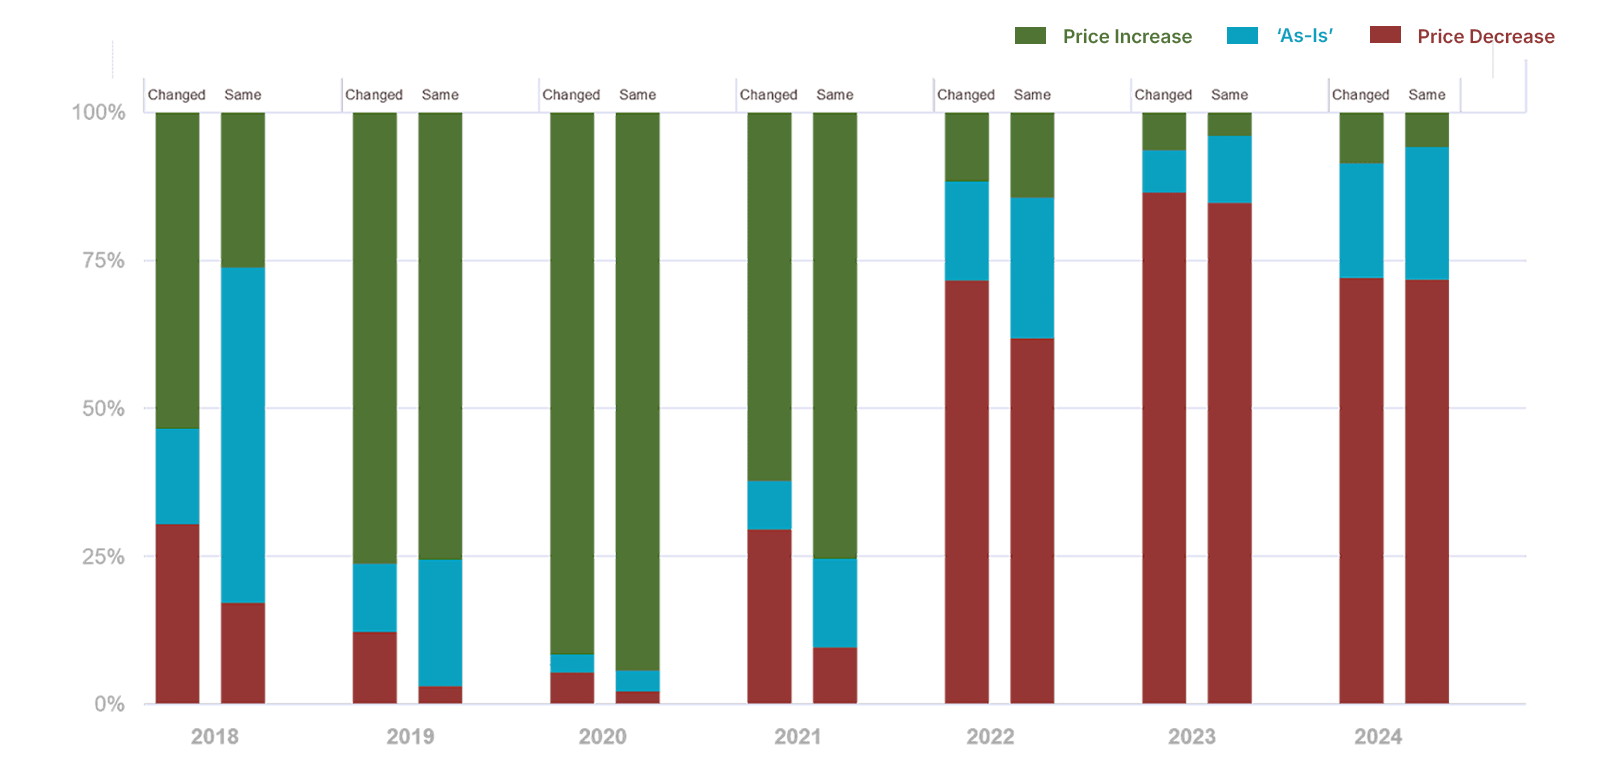
- In 2018 most insureds stayed with their carrier and renewed flat. Those who changed did so for a reason – some jumped, others were pushed.
- By 2020 the market correction was evident and changing carriers made little difference
- Since 2022, as the market has softened, so the difference in outcome has narrowed. Put another way, ongoing price reductions are widespread among incumbents and competitors alike
We used Schedule P’s D&O supplement to identify direct written premium changes among the biggest D&O writers over the past two years.
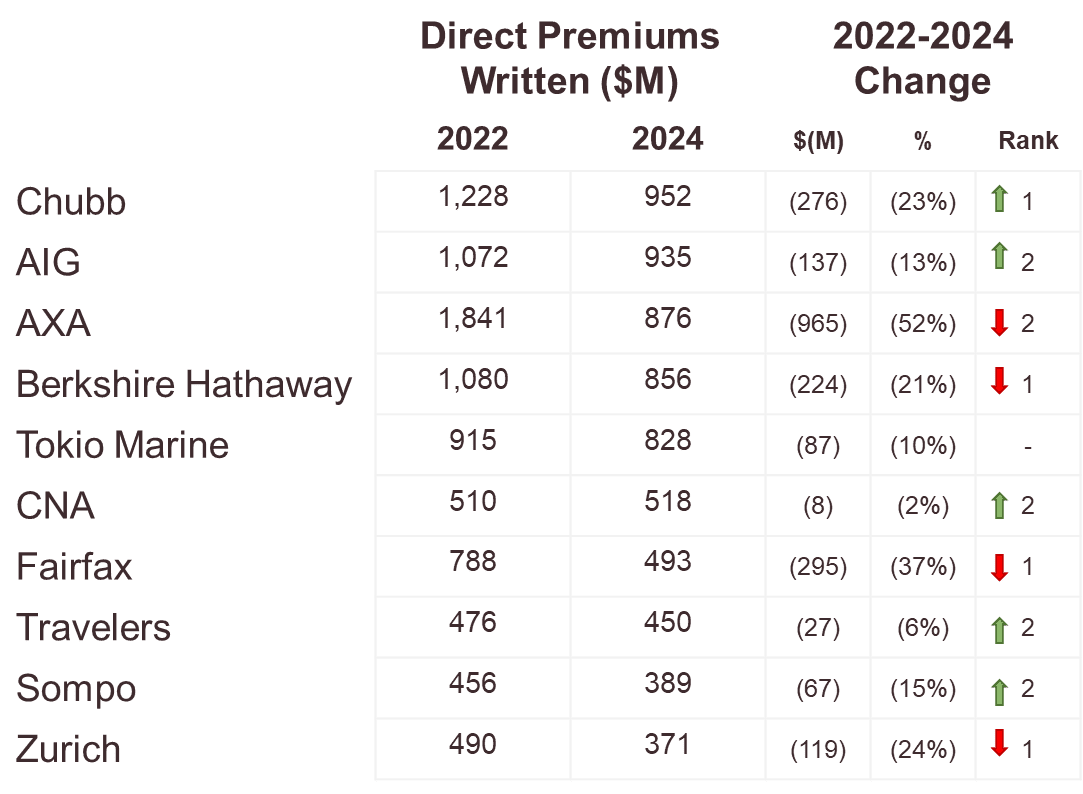
- There has been very little movement in the relative positions of top D&O writers
- Some have reduced premiums significantly, many have not
- Collectively, the datapoints suggest the premium reductions have been driven by price reductions rather than aggressive non-renewal of business
3. LOSS RATIOS
Our simplified profitability math remains the same:

How do results look against our math?
U.S. Commercial Public D&O Insurance
Expected Ultimate Loss Ratios and Margin $, 2013-2025 (TransRe Projected)
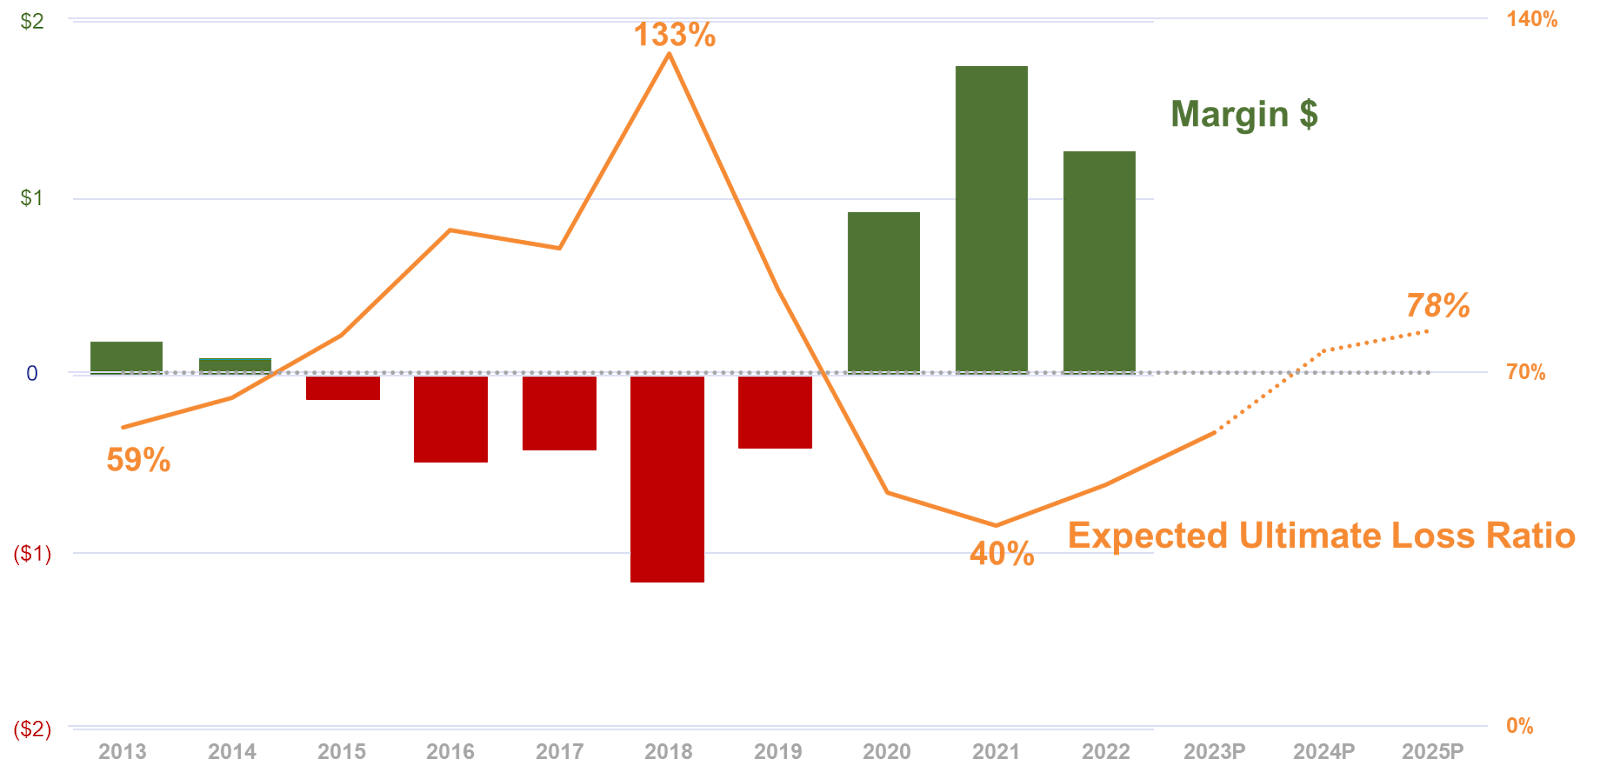
- We excluded FI, because it is Commercial pricing that is of most (current) concern
- ‘Margin$’ = GWP x {70%-expected ULR}
- 2019-2020 rate increases delivered positive results
- Subsequent price activity means ULRs are drifting back above ‘breakeven’
How have the results developed over time?
Industry Ultimate Loss Ratio Development By Accident Year
Schedule P, Other Liability Claims Made, 2015-2024
- 2016-2019 – the ‘older’ years continue to get worse
- 2020-2022 – more recent years continue to get better
- Initial picks for 2020-2021 were very conservative, at the height of pandemic concerns
The data does not support the contention that ‘we are giving away price, but we are still profitable’.
4. LOSS DRIVERS
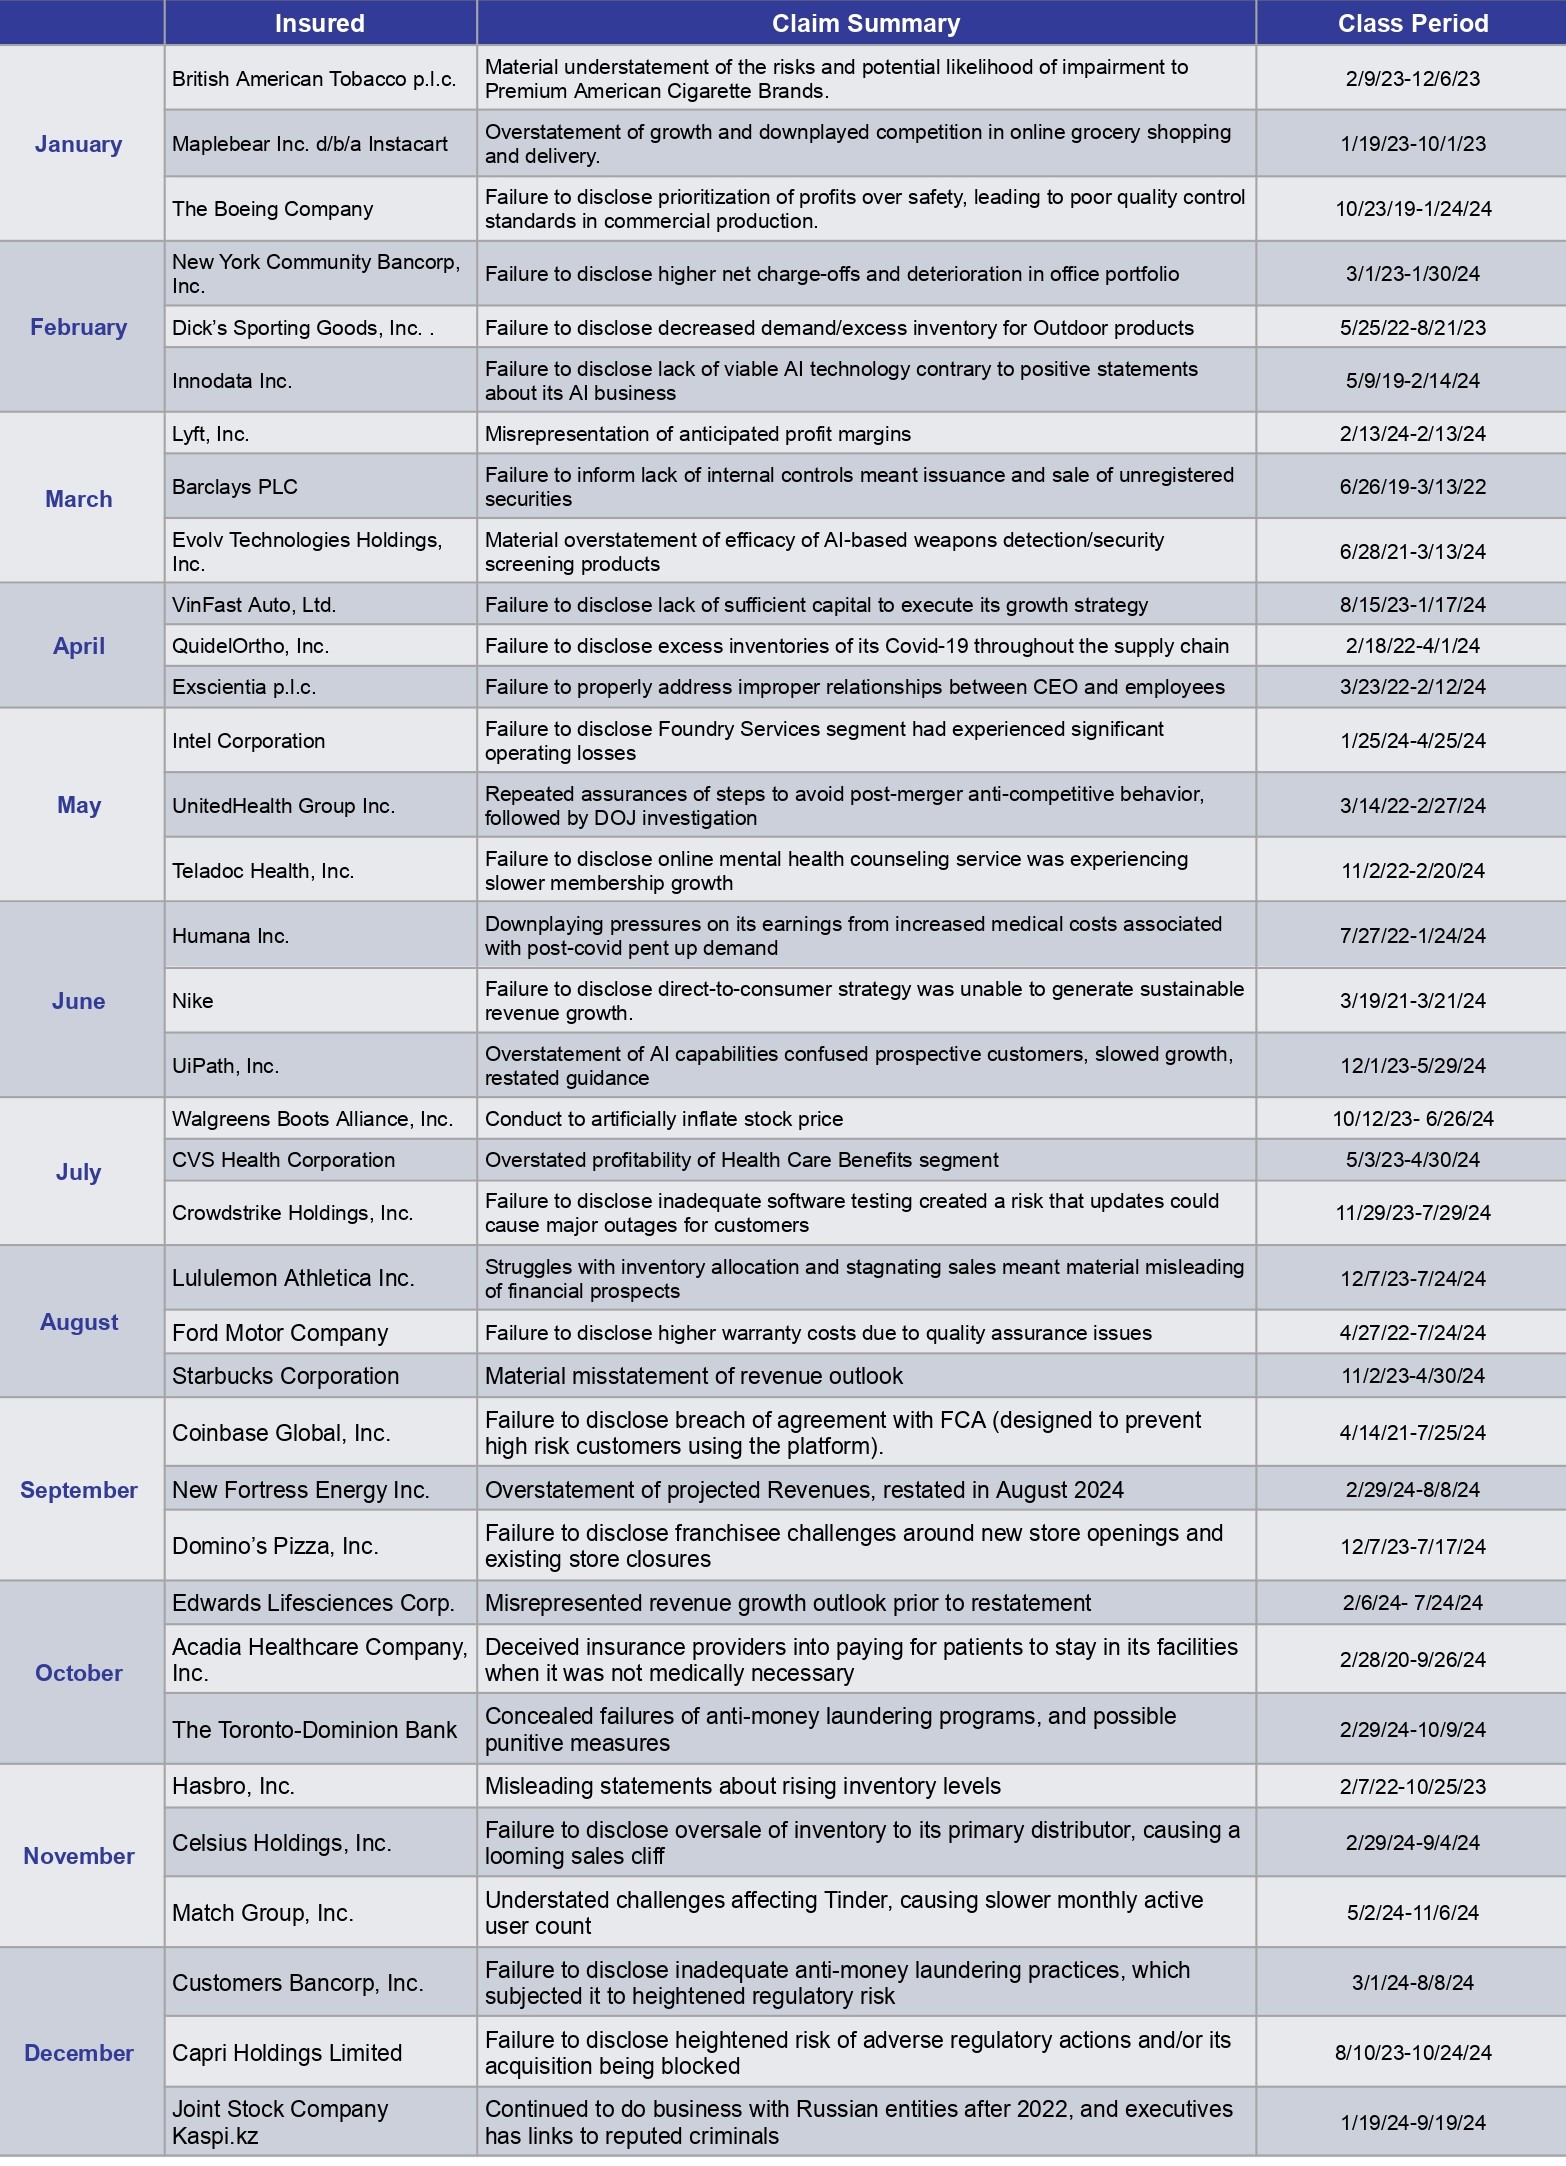
To maintain an accurate and up-to-date view of D&O claim trends, we track both primary sources (securities class action filings) and secondary research (Stanford Law School’s Securities Class Action Clearinghouse, Cornerstone Research, Dowling Research, Bloomberg Law and Institutional Shareholder Services’ Securities Class Action Services). We split our case data between securities class actions and derivative suits and we add ‘latest filings of interest’. These are available upon request.
Loss ratios are the product of filing frequency and outcome severity:
Our frequency view excludes merger objections to focus on ‘core’ claims:
Legal Filings For ‘Core’ Claims
Ex. Merger Objection, 2013-2024
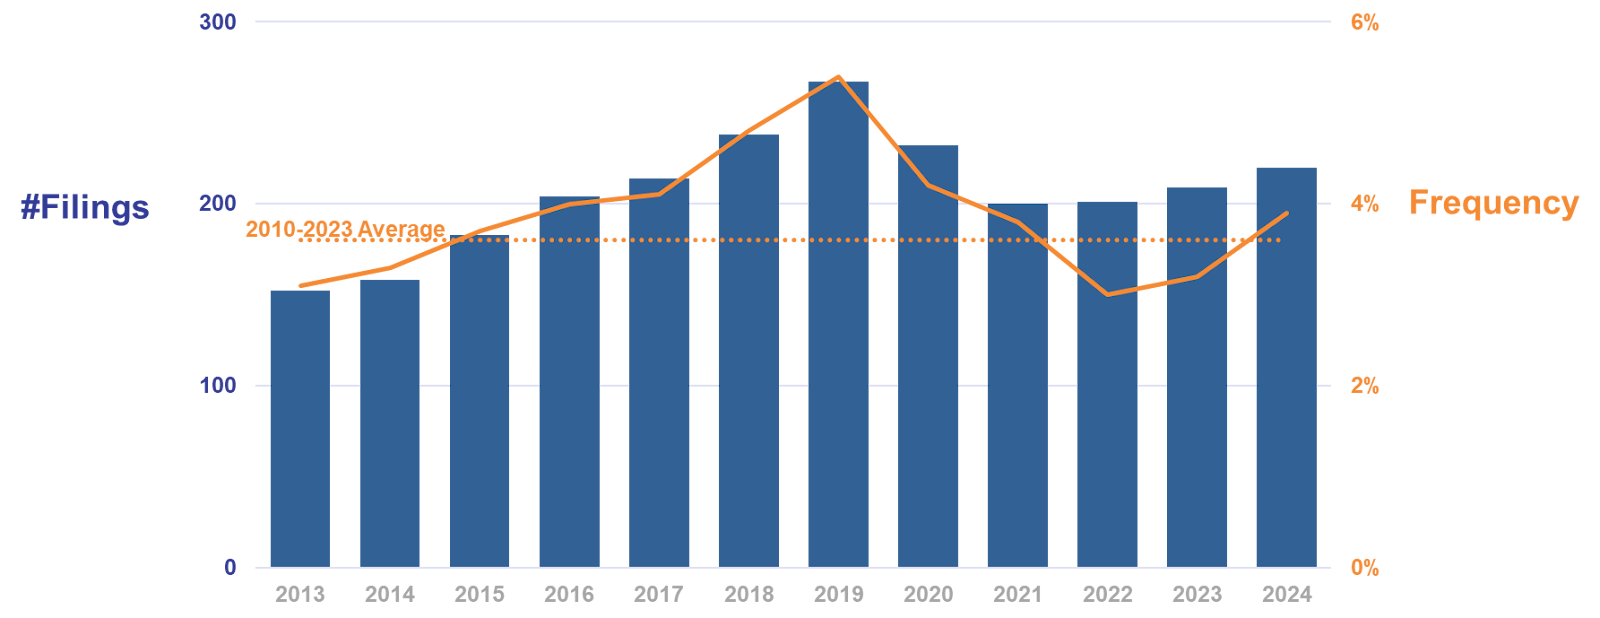
- Core filings are back above the long-term average
- With few new IPOs to increase the denominator, frequency follows filings
For a perspective on severity, Cornerstone Research’s just-published 2024 SCA Review notes that total settlement $ and the median settlement amount have both declined against 2023, but remain elevated compared to the past decade. The rationale for 2024’s drop includes:
- institutional investors were involved in fewer cases (smaller claims)
- more of the defendants also delisted and/or declared bankruptcy (fewer assets)
- more SPACs (which tend to settle for smaller amounts)
However, legal fee inflation remains elevated and, given recent filing trends (e.g. AI-related filings more than doubled from 2023 to 2024) and elevated levels of proxies for potential investor losses, Cornerstone expect settlement amounts to remain at ‘relatively high levels’ going forward. We don’t disagree.
The recent downward trend in frequency has halted, but not reversed, and severity shows little sign of easing. Losses remain a concern.
About Our Database, Methodology, Sources
1. Over decades (and billions of premiums and corresponding claim payments) we have accumulated significant management and professional liability data and insights. We supplement this with licensed third party data and publicly available information, combined into our proprietary analytics engine.
2. Our database includes details of 30,000+ policies.
3. To deliver our analysis we separate Financial Institutions from Commercial, which we further sub-divide by company size and attachment point:
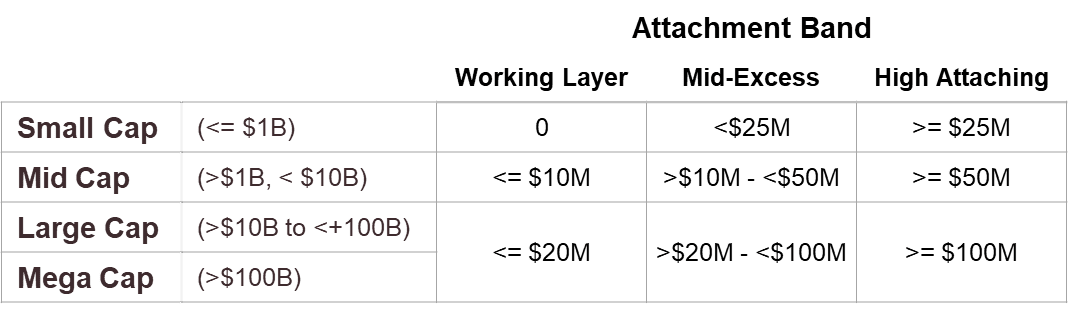
(Note the addition of Mega caps, consistent with analyses we share with clients).
4. We have focused on price rather than rate, to exclude (untrackable) changes in coverage.
5. In addition to general (CPI) inflation, we closely monitor two specific types of inflation which directly impact management liability:
a. Legal service inflation (LSI) which impacts loss adjustment expenses. According to the US Bureau of Labor Statistics) LSI was 4.9% in 2022, 6.3% in 2023 and 8.3% for 2024 (well above the 2015-2024 average of 4.3%).
b. Underlying loss cost trend (not just defense costs) which reflects increased severity as the plaintiffs’ bar pursues fewer but more likely cases and asks for more.
6. We only include the business we see. While we believe this to be a majority of what is available, it is not the entire market.
Appendix – Detailed Indices
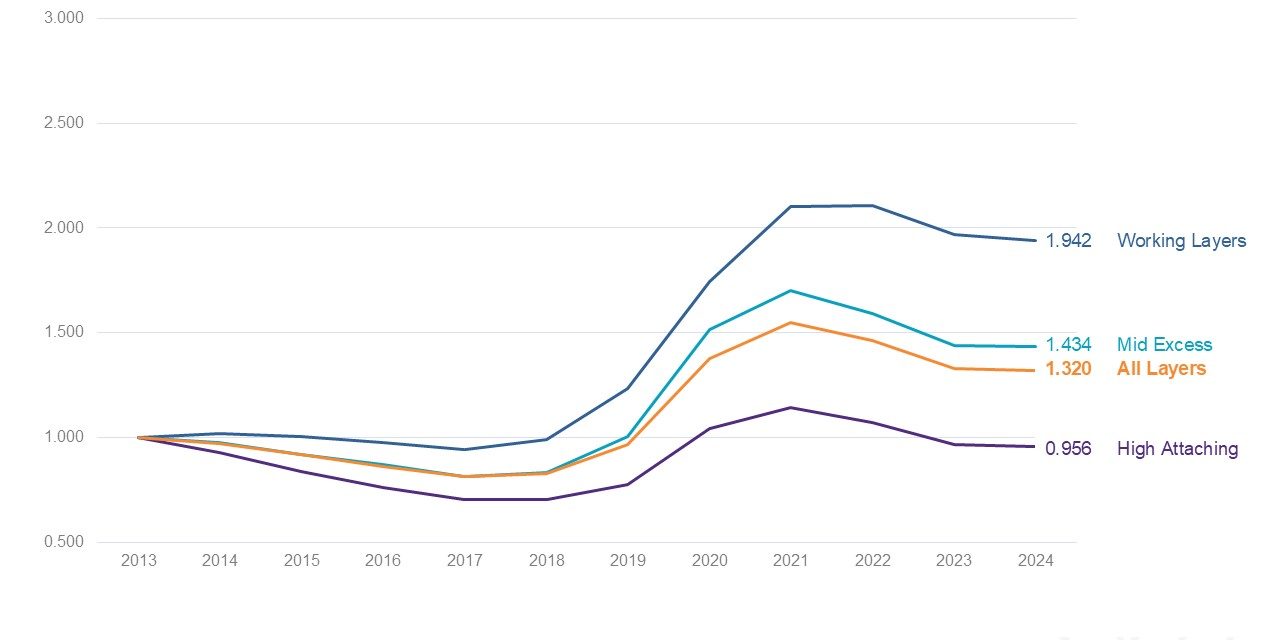
All Policies
Small Cap, 2013-2024
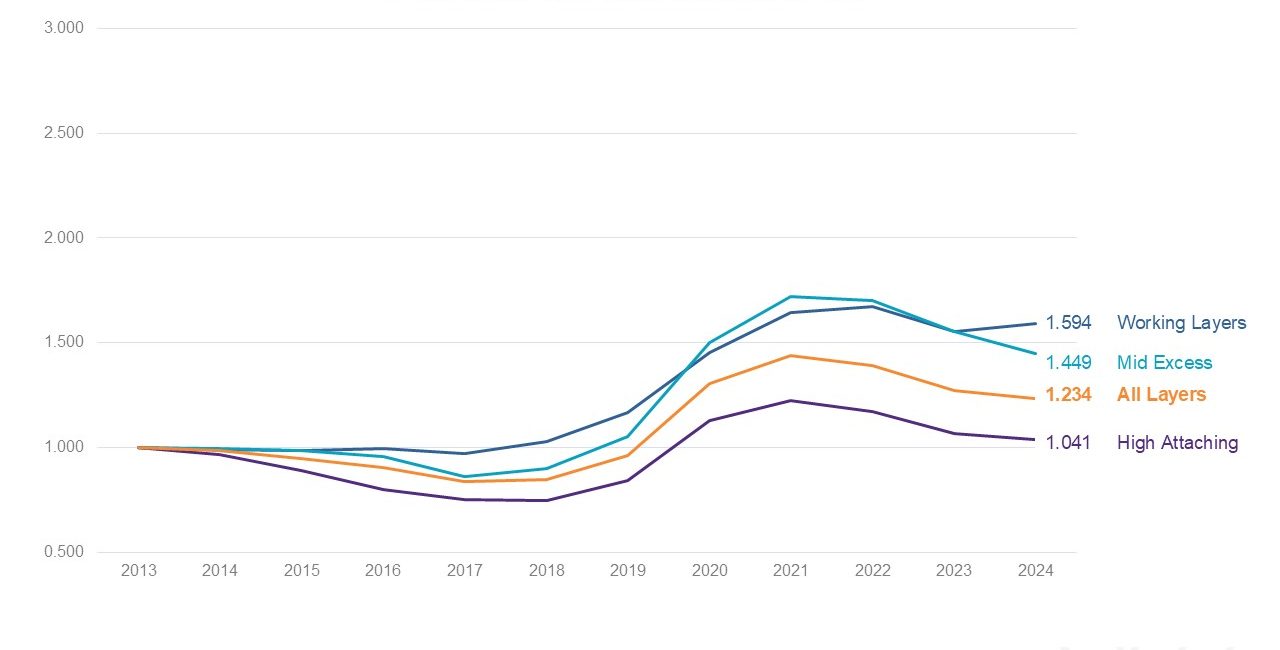
Mid Cap, 2013-2024
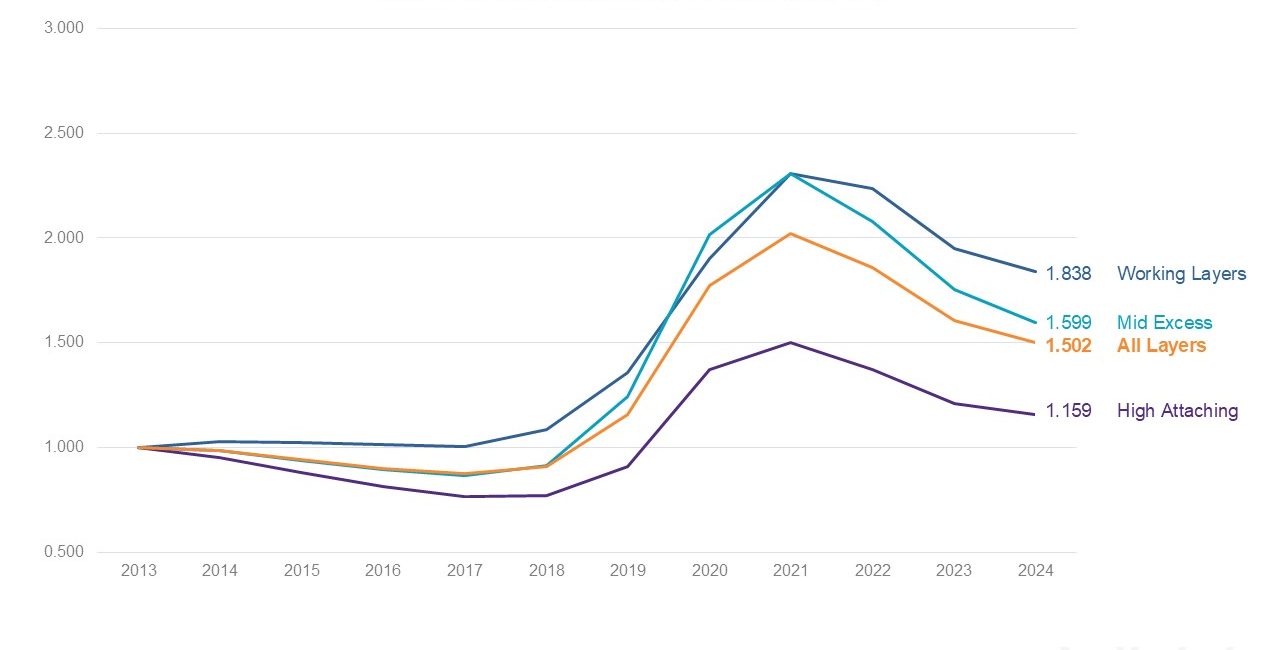
All Policies, Large Cap, 2013-2024
All Policies, Mega Cap, 2013-2024
Commercial Only
All Insureds, By Layer, 2013-2024
Small Cap, 2013-2024
Mid Cap, 2013-2024
Large Cap, 2013-2024
Mega Cap, 2013-2024
Financial Institutions Only
All Caps, 2013-2024
Appendix – SCA Claim Monitor
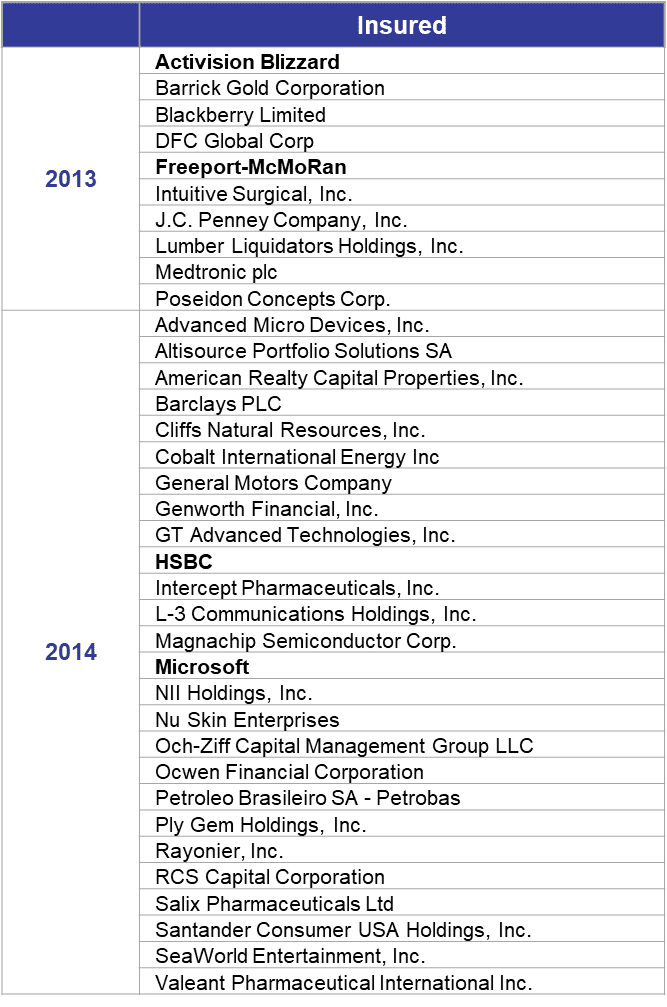
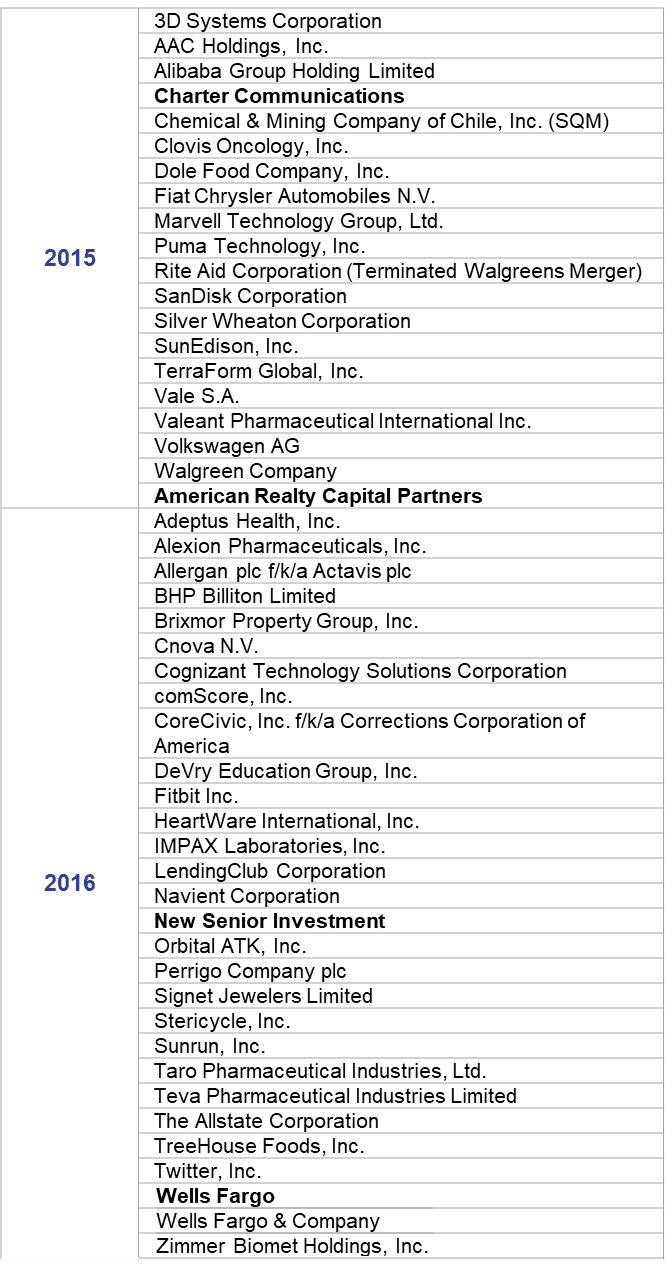
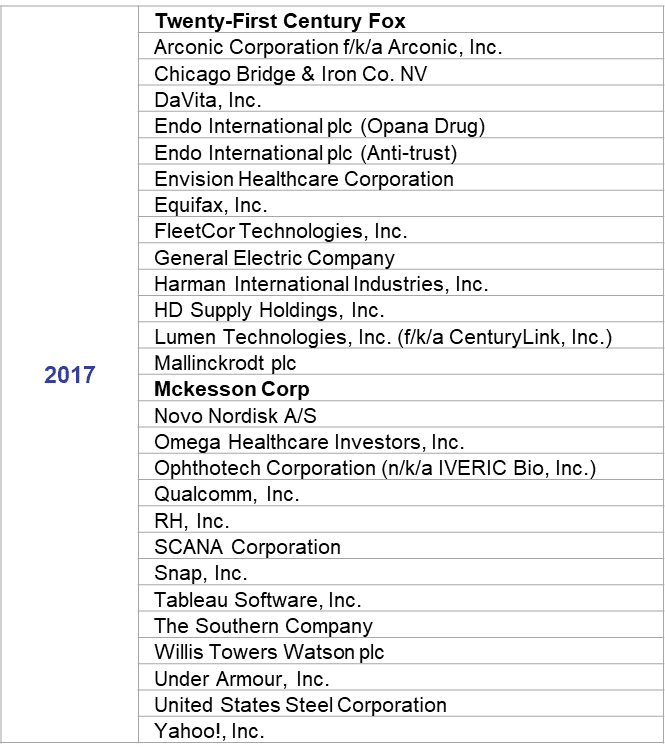
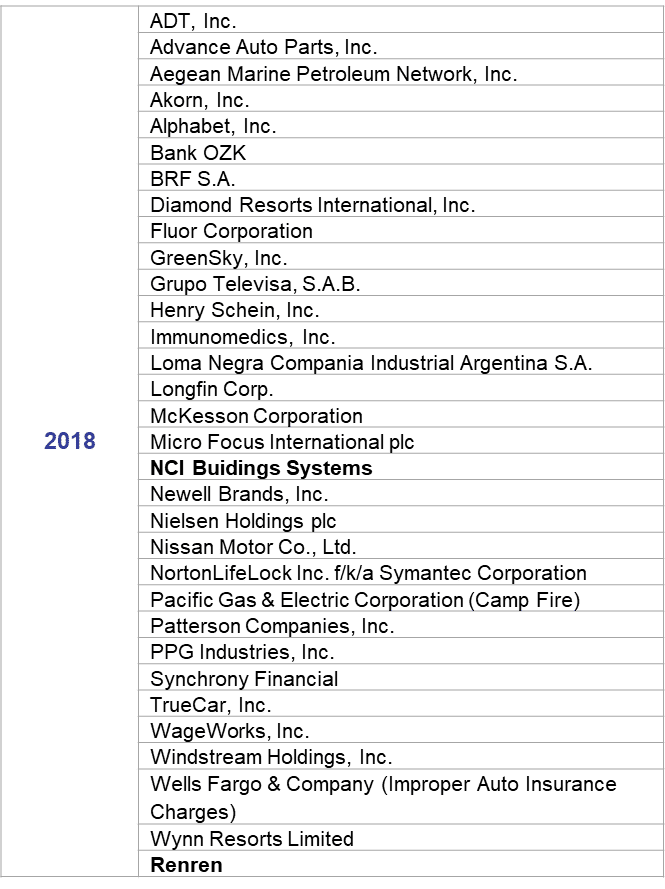
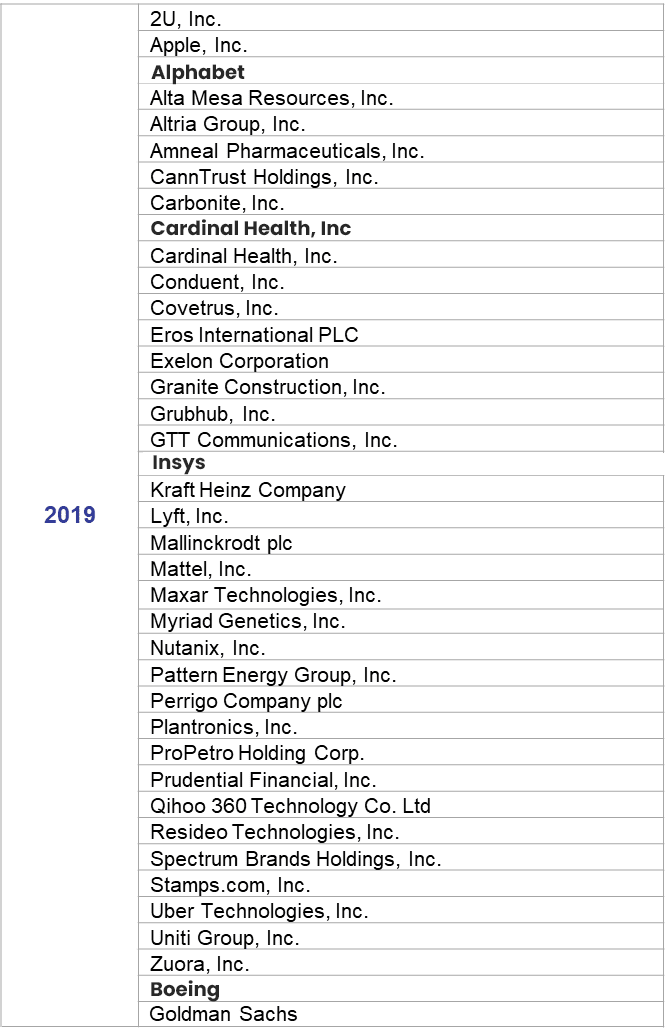
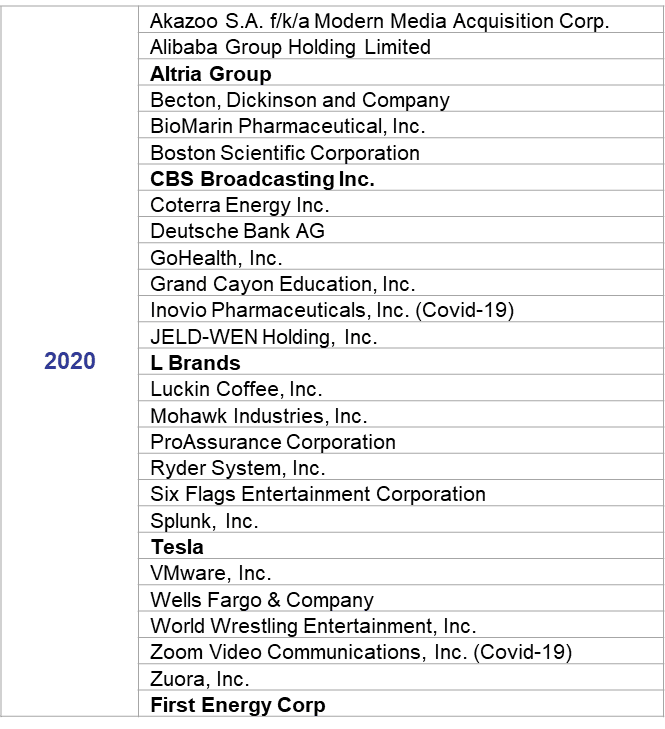
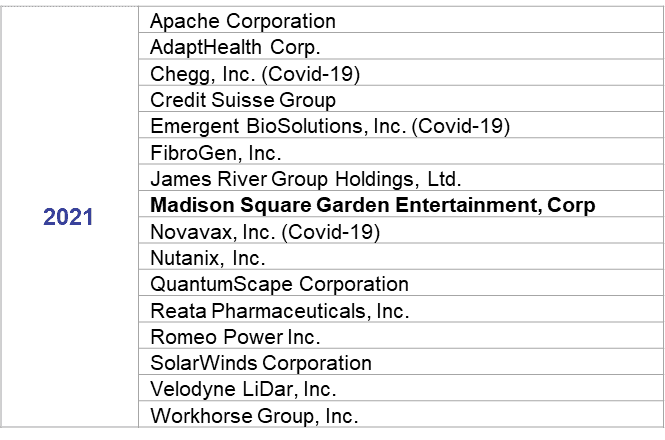
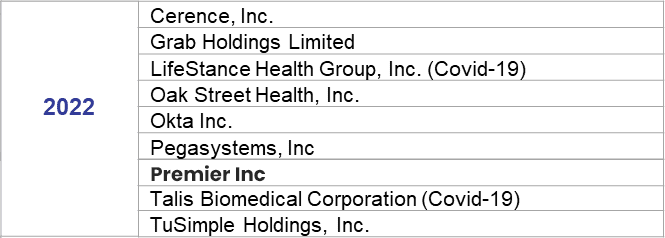
Appendix – Significant ($25M and above) D&O Settlements
By Year of Filing
Derivative suits are bolded – the balance are securities class actions.