After a decade of success, have underwriting returns reached ‘what looks like a permanently high plateau’ of profitability?
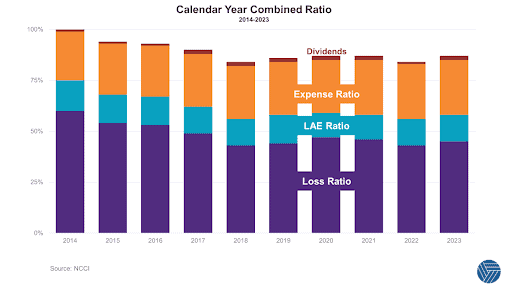
Workers’ compensation insurers have enjoyed a decade of success.
From an accident year perspective, initial combined ratio picks have turned out to have been conservative, resulting in significant reserve releases throughout the period.
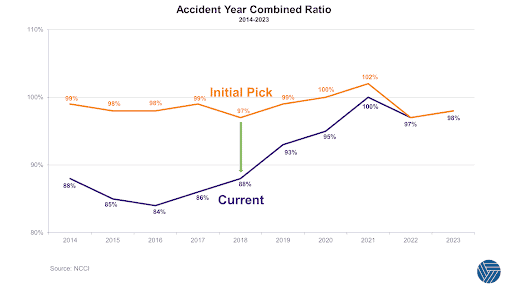
On a calendar year basis, the market has delivered combined ratios better than 100% every year since 2014 (having done so only once in the previous decade).
How has such profitability been possible, given increased competition in the market and the resultant broadening of terms and reduction of rates? The National Council on Compensation Insurance provides industry data and insights. They suggest that workers’ compensation insurance has entered a new era of low volatility with more consistent results and fewer of the steep peaks and troughs that have characterized previous market cycles.
We have identified four main drivers of recent profitability. Some do indeed reflect secular changes within workplaces, but we note with caution that others remain more cyclical in nature. In summary those drivers are:
1. Changing Work Environment Improves Claim Frequency
Fundamental shifts have taken place in how Americans works. For office and healthcare workers that has meant more remote/hybrid work and fewer commutes. Factory workers have seen significant investments in and focus on workplace safety. Many of the most hazardous jobs have benefited from increased automation.
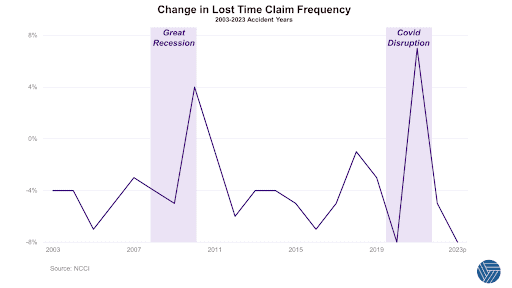
As a result the number of claims for lost worktime has declined in eighteen of the past twenty years and overall the number of claims declined by an annual average rate of 3.4% over the same twenty years.
2. Wage Inflation & Lower Severity Trends
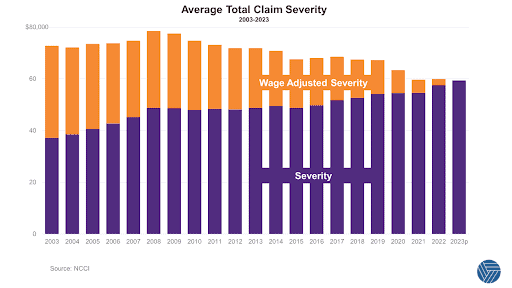
Although claim severity does increase due to higher wages and medical costs, those higher wages also increase the premium base. Adjusted for higher payrolls, claim severity peaked in 2008 at $78,500 (2023’s figure is $59,400). The average wage-adjusted claim severity has dropped 1% annually over the past twenty years.
The lower severity trends are the result of several favorable market developments:
- Medical & indemnity costs have become more consistent with the introduction of fee schedules and schedules of loss
- There has been downward pressure on prescription costs, and fewer opioids have been prescribed, lowering overall medical costs and increasing case closure rates
- Claims practices have improved
- Claims teams have become better at identifying large losses at early stages, possibly leading to more favorable outcomes
- A higher percentage of claims are now being settled, meaning claims teams have been able to limit loss development
However welcome these developments have been, we note that not all of these conditions are permanent. For example, there are fewer independent doctors in the U.S. as medical groups continue to expand, and such groups have more negotiating power when it comes to fee schedules, hindering carriers’ ability to limit adverse medical claims.
More importantly, the downward wage-adjusted severity trend is dependent on wage inflation continuing to outpace medical inflation. Any economic downturn would likely reverse that positive direction – the rise in severity in 2008-2009 coincides with the Great Recession.
3. Benign Economic Conditions Have Kept Claims Down
The other economic factor involves interest rates. For most of the past decade, low interest rates have promoted economic growth and workforce expansion. Since employers pay insurers premiums that are a percentage of payroll, expanding workforces and wages generates expanding premiums.
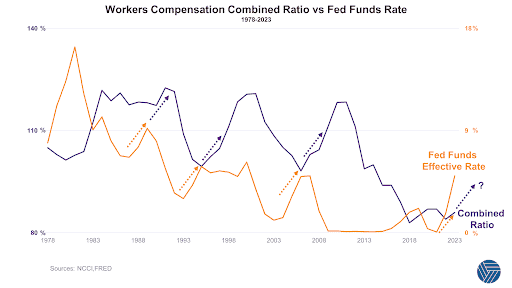
However, higher interest rates encourage competition among insurers and many new entrants have been tempted to enter the market to chase higher investment yield when interest rates swell. These cash flow underwriting practices inevitably soften the market, causing losses to rise. It is an observable trend that workers’ compensation combined ratios tend to spike two to three years after rate hikes:
4. Fewer U.S. Catastrophes Have Kept Claims Down
Although less exposed to catastrophe risk than other lines of business, workers’ compensation policies typically do not have limits which creates the possibility for acute loss aggregation. Despite this, the past decade’s underwriting success owes some of its success to little impactful catastrophe activity.
As we have previously noted, nearly half of Americans are exposed to potentially damaging earthquakes, but it has been 30 years since the last catastrophic earthquake struck Northridge, and that was at 4:30 am local time, significantly reducing its impact on this line of business.
Over 20% of U.S. workers’ compensation premium is written in California, so any similar event during normal working hours would have a significant impact on loss ratios and insurer appetite. In 2019 RMS estimated that a repeat of the 1906 San Francisco Earthquake would cause 7,300 injuries, 1,900 fatalities, and ~$1 billion of workers’ compensation losses. Remember the 1906 quake also happened early (5:12am local time). Should an earthquake on the same scale strike during peak work hours, RMS trebled their estimates, to 22,000 casualties, 5,800 fatalities and ~$3 billion losses.
Workers’ Compensation catastrophe risk is compounded by medical inflation. In cases of extreme injury, insureds may require medical attention for the rest of their lives, meaning insurers may collect premiums in today’s dollars but are liable to pay inflated medical bills decades into the future.
We do not know when the next major U.S. earthquake will occur, but uncapped policies and medical inflation leave insurers exposed to a fat tail should the next major event occur during normal working hours – whether that be an earthquake, terror attack, or any other widescale medical disaster.
What’s Next For Workers’ Compensation?
As reinsurers of workers’ compensation carriers, we are keen observers of market dynamics.
It is true that workplaces have become safer, and that fee schedules and schedules of loss have slowed the rise of medical and indemnity costs. It is also true the past decade’s performance (which followed some lousy decades of underperformance) has benefited from benign economic and catastrophe conditions.
We anticipate insurers will continue to fight for market share until a major cat event or prolonged economic downturn occurs, and that the private market continues to take share from state funds. Interest rates are off their recent peaks, but investment yields remain higher than they have in many years, which may encourage cash flow underwriting by some.
The reinsurance market is dominated by XOL placements so support for market-share fights will be limited to those with a high tolerance for cat exposure.
While we cannot predict the future, we find scenarios to be helpful.
Scenario 1: fewer dangerous jobs, wages continue to rise faster than medical costs, the economy continues to expand and no catastrophes impact the workforce. In this scenario, rates may continue to decline.
Scenario 2: economic conditions turn down, a catastrophic event occurs during the work day, medical inflation accelerates. In this scenario, rates should accelerate to deliver underwriting profit, irrespective of investment yields.
https://www.ncci.com/Articles/Pages/Insights-AIS2024-State-Economy-Impact-onWorkersComp.aspx
https://www.ncci.com/SecureDocuments/AES_Content/II_UW_Results_Complete_Rpt-2022.html
https://www.rms.com/exposure/shaking-up-workers-compensation
https://www.federalreservehistory.org/essays/stock-market-crash-of-1929
Contacts
To discuss any aspect of this overview, or your ongoing Workers’ Compensation reinsurance needs:
Portfolio Management
Jake Borsellino
Maryam Haji
Keith Trigg
Underwriting
Eric Hoppe
Ian Carmody
Actuarial
Bobby Fogelson
Jennifer Carella
You can also reach us at Communications@transre.com.
Legal
Reproduction in any form without permission of TransRe is prohibited.
The material and conclusions contained in this document are for information purposes only and TransRe offers no guarantee for the completeness of its contents.
Statements in this document may provide current expectations of future events based on certain assumptions. These statements involve known and unknown risks, uncertainties and other factors which are not exhaustive. Although TransRe makes reasonable efforts to obtain information from reliable sources, TransRe does not guarantee the accuracy or completeness of the information given or any forward-looking statements made.
TransRe undertakes no obligations to revise or update any statements, whether as a result of new information, future events or otherwise, and in no event shall TransRe or any of its affiliates or employees be liable for any damage or loss arising in connection with the use of the information relating to this document.
